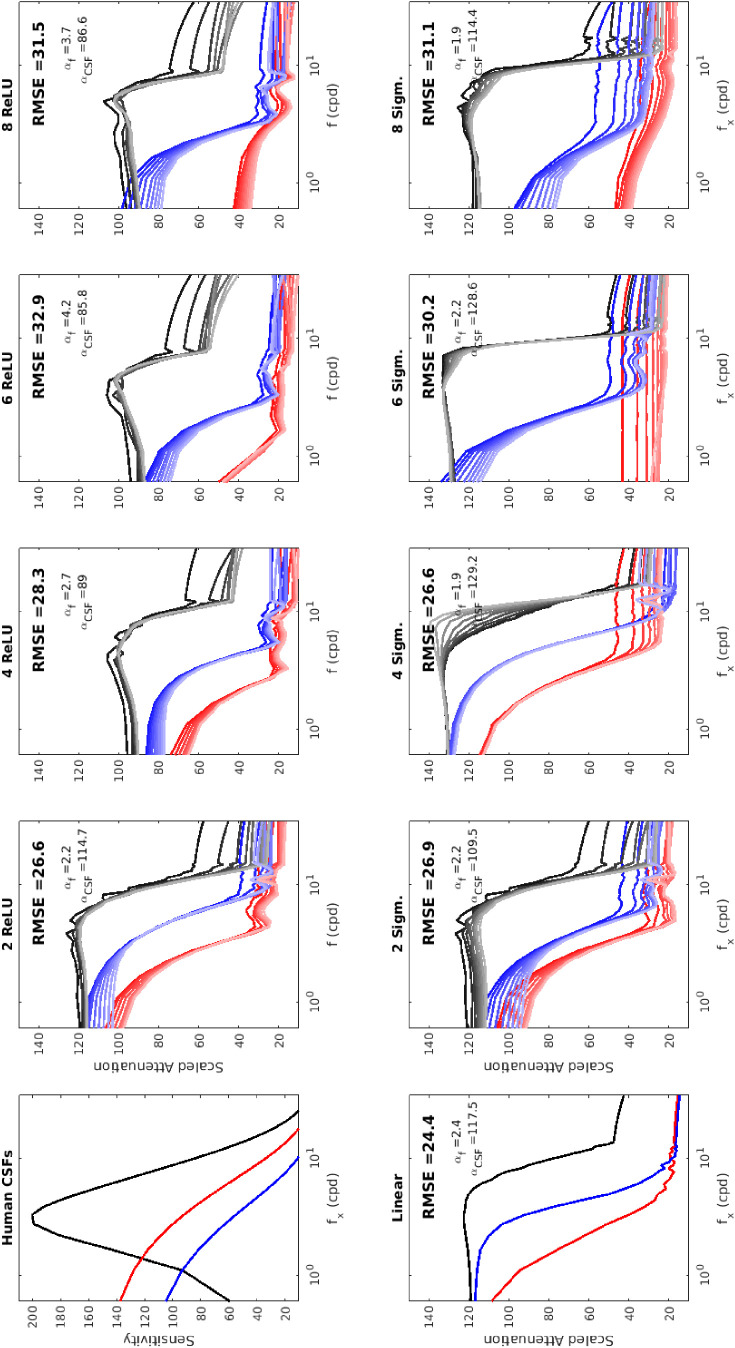
Figure 5.
Experiment 1 (spatiochromatic CSFs from the compensation of biodistortion). Attenuation factors for gratings of different contrast for a range of CNN autoencoders trained for biodistortion compensation. Achromatic, blue, and red lines refer to the CSFs of the achromatic, red–green, and blue–yellow channels, respectively. Dark to light colors refer to progressively higher contrasts (evenly spaced in the range [0.07–0.6]). The human CSFs (top left) and the CSFs of the optimal linear solution (bottom left) are also shown as a convenient reference. RMSE measures describe the differences between the model and the human CSFs. The plots also display the values for the scaling factors in frequency and amplitude described in the text, Equation 11.

