Figure 7.

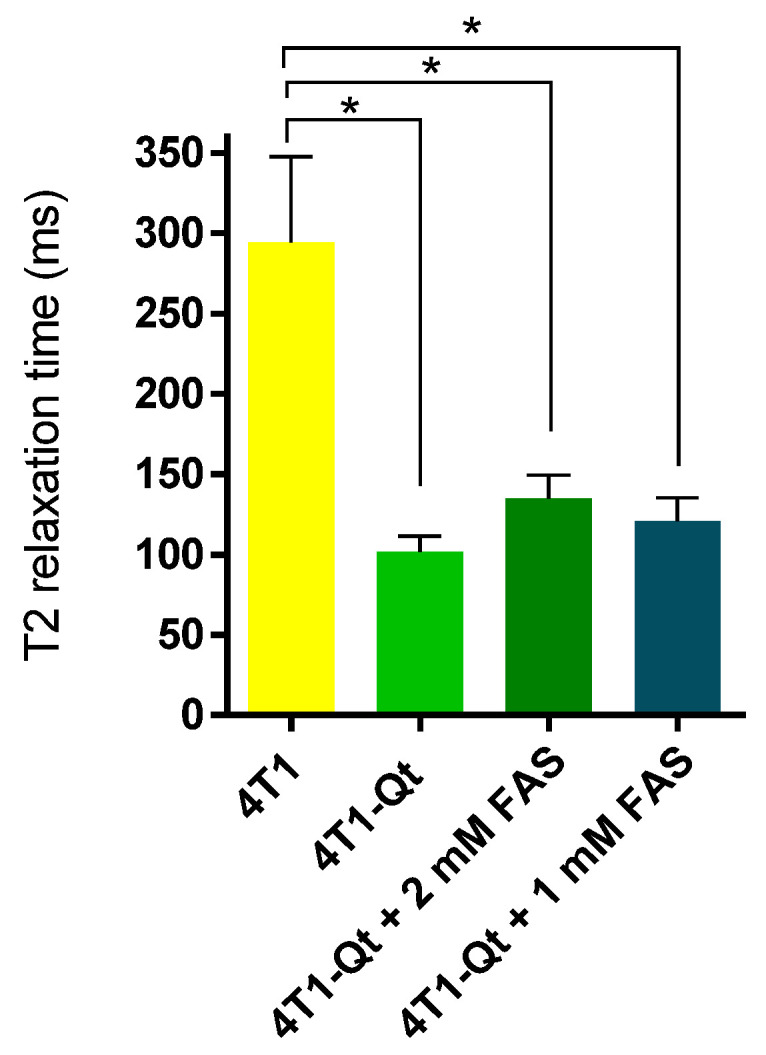
T2 relaxation time for 4T1 and 4T1-Qt cells. The data are shown as the mean + S.D. Statistical analysis was performed using an unpaired t-test (* corresponds to p-value < 0.05).

T2 relaxation time for 4T1 and 4T1-Qt cells. The data are shown as the mean + S.D. Statistical analysis was performed using an unpaired t-test (* corresponds to p-value < 0.05).