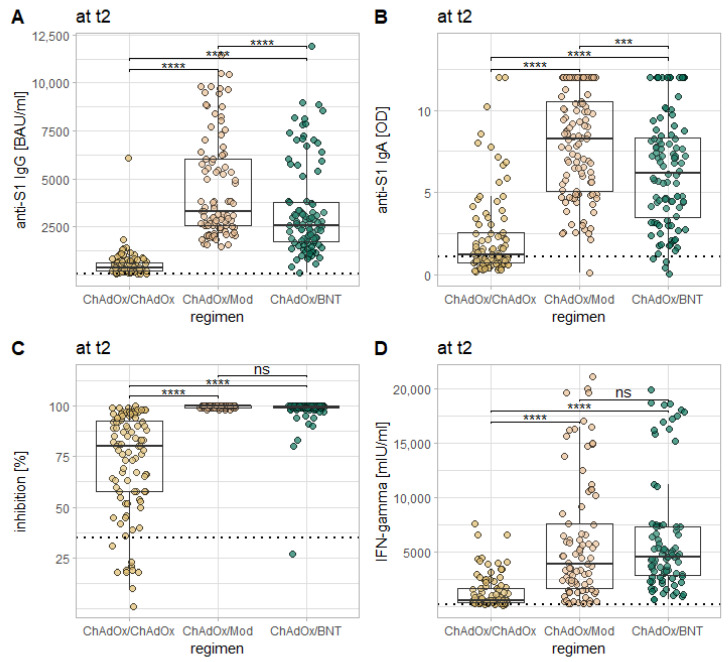
Figure 5.
Comparison of the examined immune responses 14 days after the second vaccination in between the three vaccination regimes in the current study. Each plot represents a different marker: anti-S1 IgG (A), anti-S1 IgA (B), the inhibition by neutralizing antibodies (C), and T-cell response as measured via IGRA (D). The dotted horizontal lines represent the cutoff for reactivity of the different assays. Levels of significance: * = p < 0.05; ** = p < 0.01; *** = p < 0.001; **** = p < 0.0001; ns = not statistically significant.

