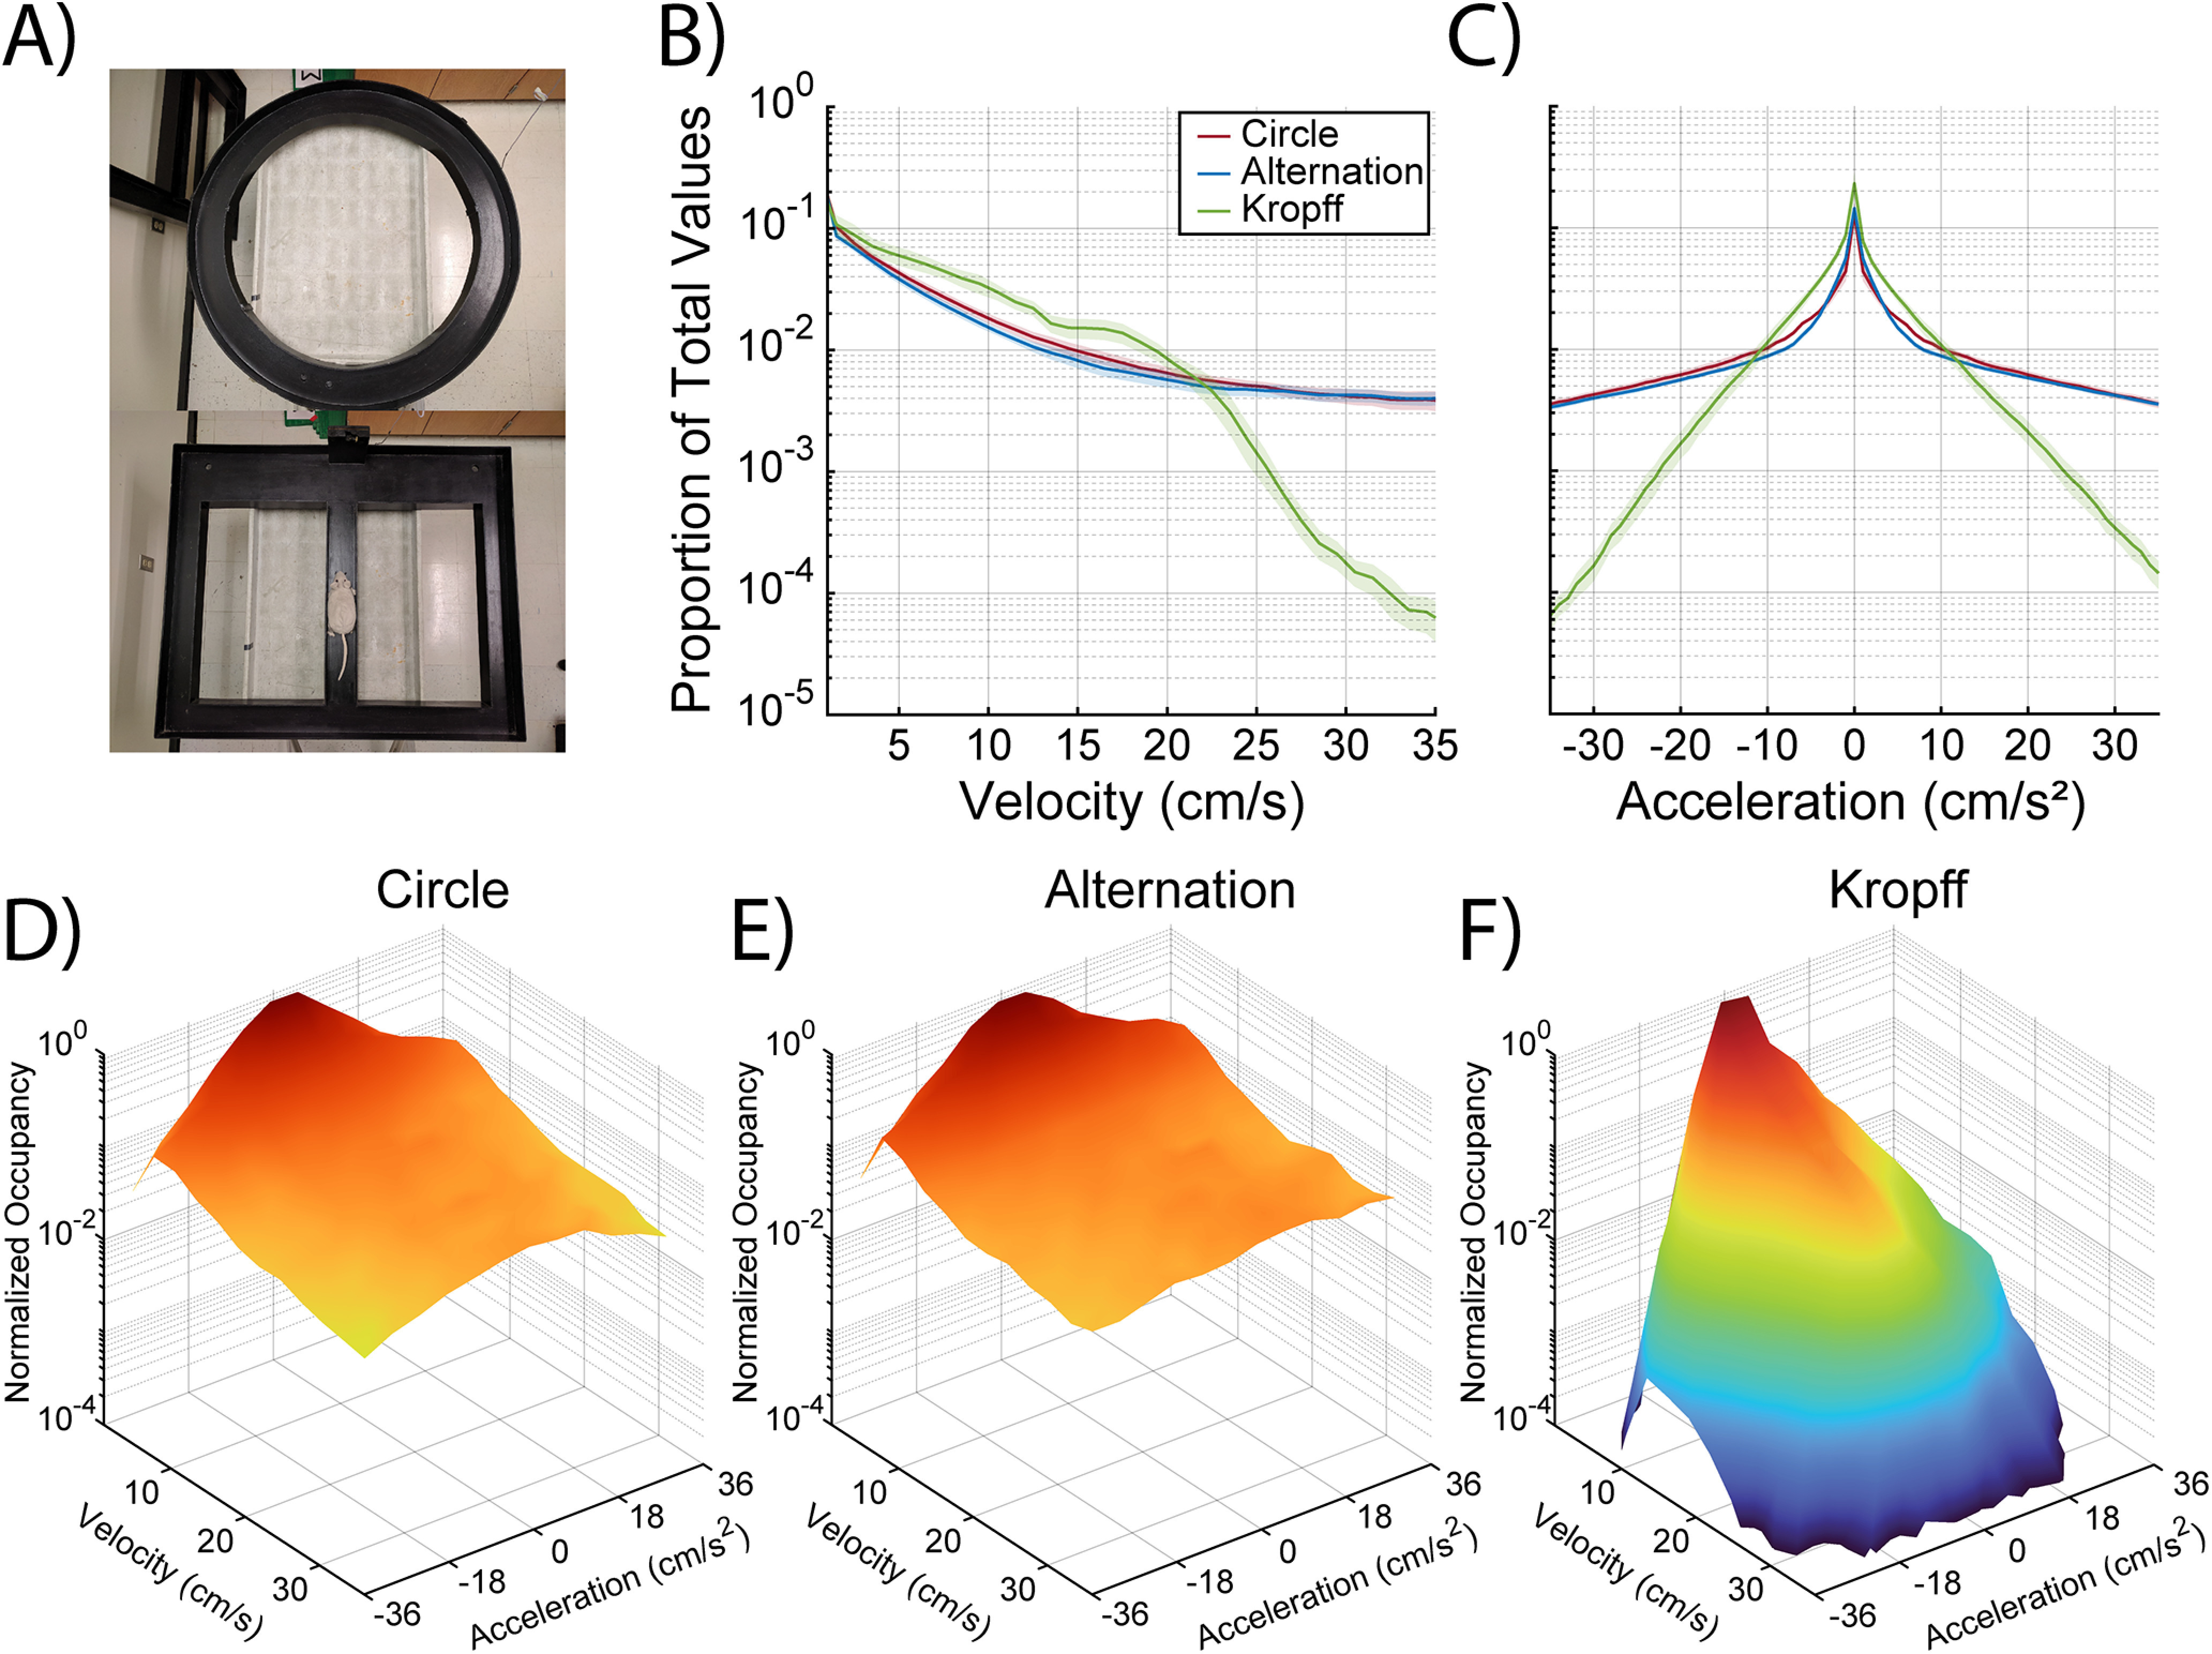
Figure 1.

Behavioral mazes and the proportion of time spent across different velocity and acceleration values. A, Animals were trained on a circle track (top) until they completed at least 30 laps in a 25-min session. They then performed a continuous spatial alternation task (bottom). Line plots showing the proportion of time animals spent at different (B) velocities and (C) acceleration/deceleration values for both circle (red) and alternation (blue) tasks, as well as data from Kropff et al. (2021b; green) for comparison. Three-dimensional plots depicting occupancy of the full parametric space for all velocity-acceleration combinations for the (D) circle track, (E) continuous alternation task, and (F) the bottomless car task used by Kropff et al. (2021a).
