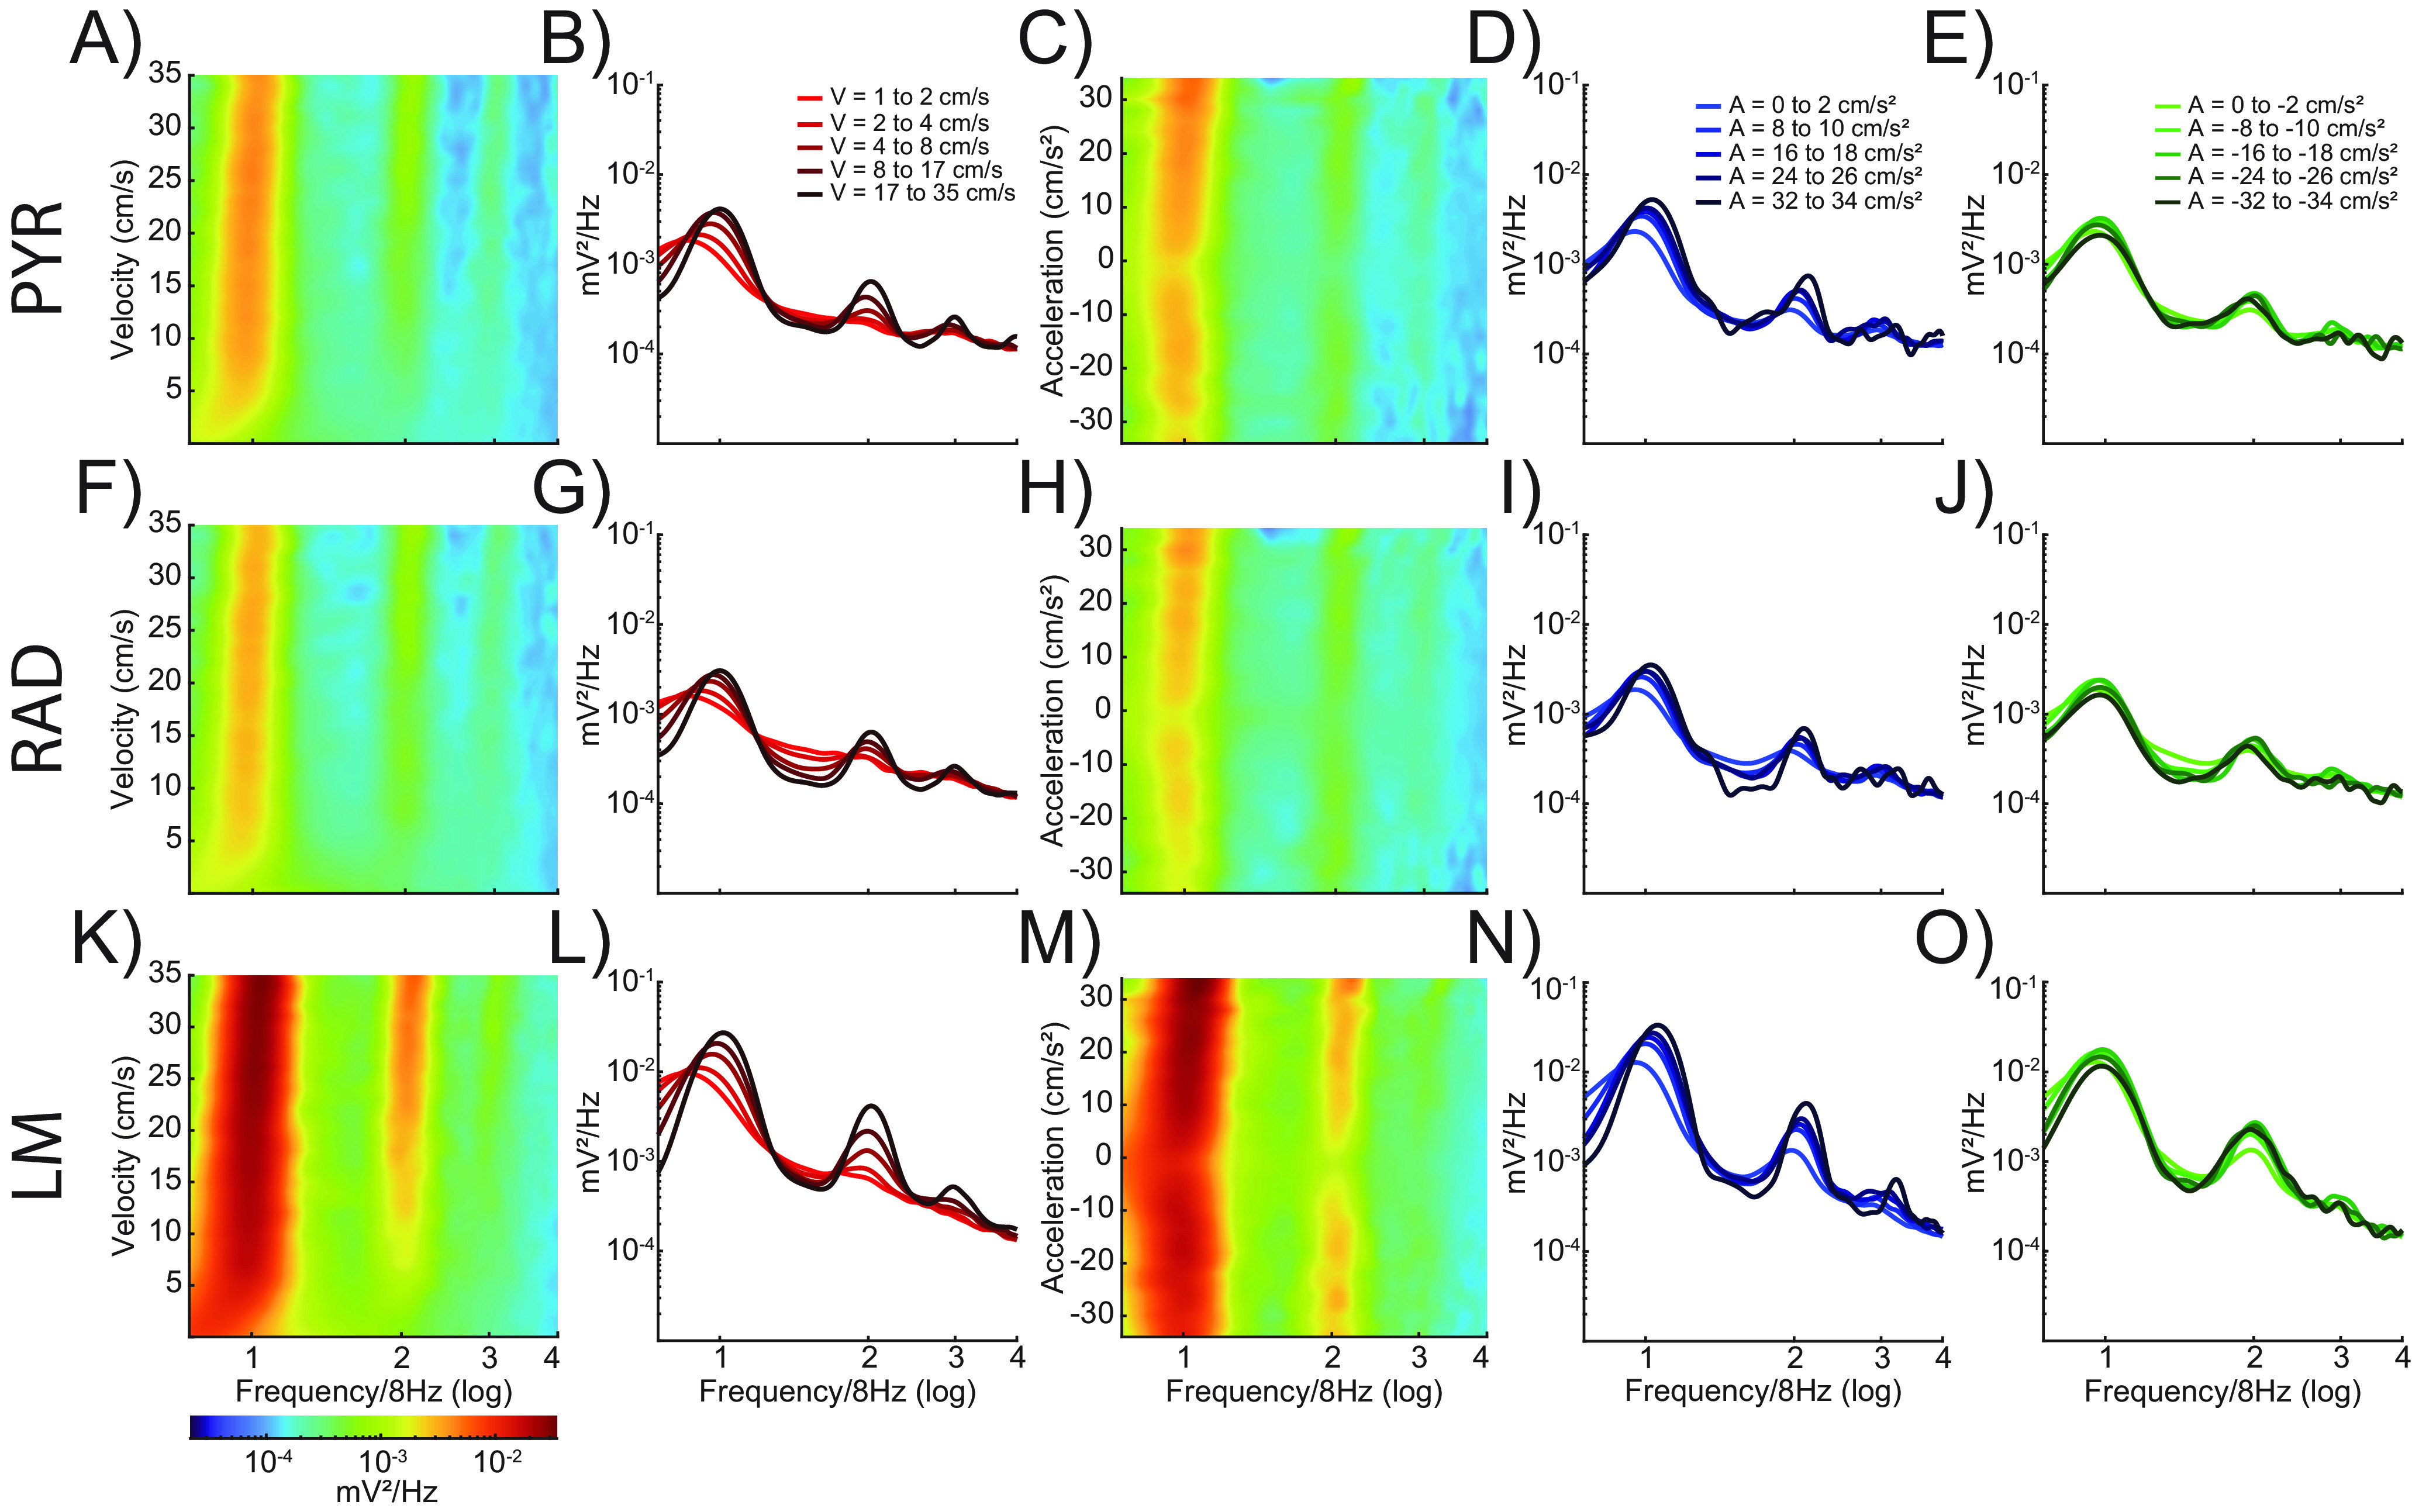
Figure 2.

Power spectral density by velocity and acceleration across CA1 lamina during circle track running. Power spectral density as a function of velocity (columns 1 and 2) and acceleration (columns 3–5) on the circle track. Spectrogram plots showing LFP power as a function of velocity or acceleration and frequency for three CA1 laminae (stratum pyramidale, A–E; stratum radiatum, F–J; stratum lacunosum moleculare, K–O). Warmer colors indicate higher power. Line plots show power versus frequency at five different values for velocity (B, G, L), positive acceleration (D, I, N), and negative acceleration (E, J, O). Increasing magnitude of velocity or acceleration is shown as changes in color intensity, with lighter lines corresponding to lower velocities or accelerations and darker lines indicating higher values. Theta power and frequency increase as a function of both velocity and acceleration; however, the change is much greater and more consistent with respect to velocity.
