Figure 8.

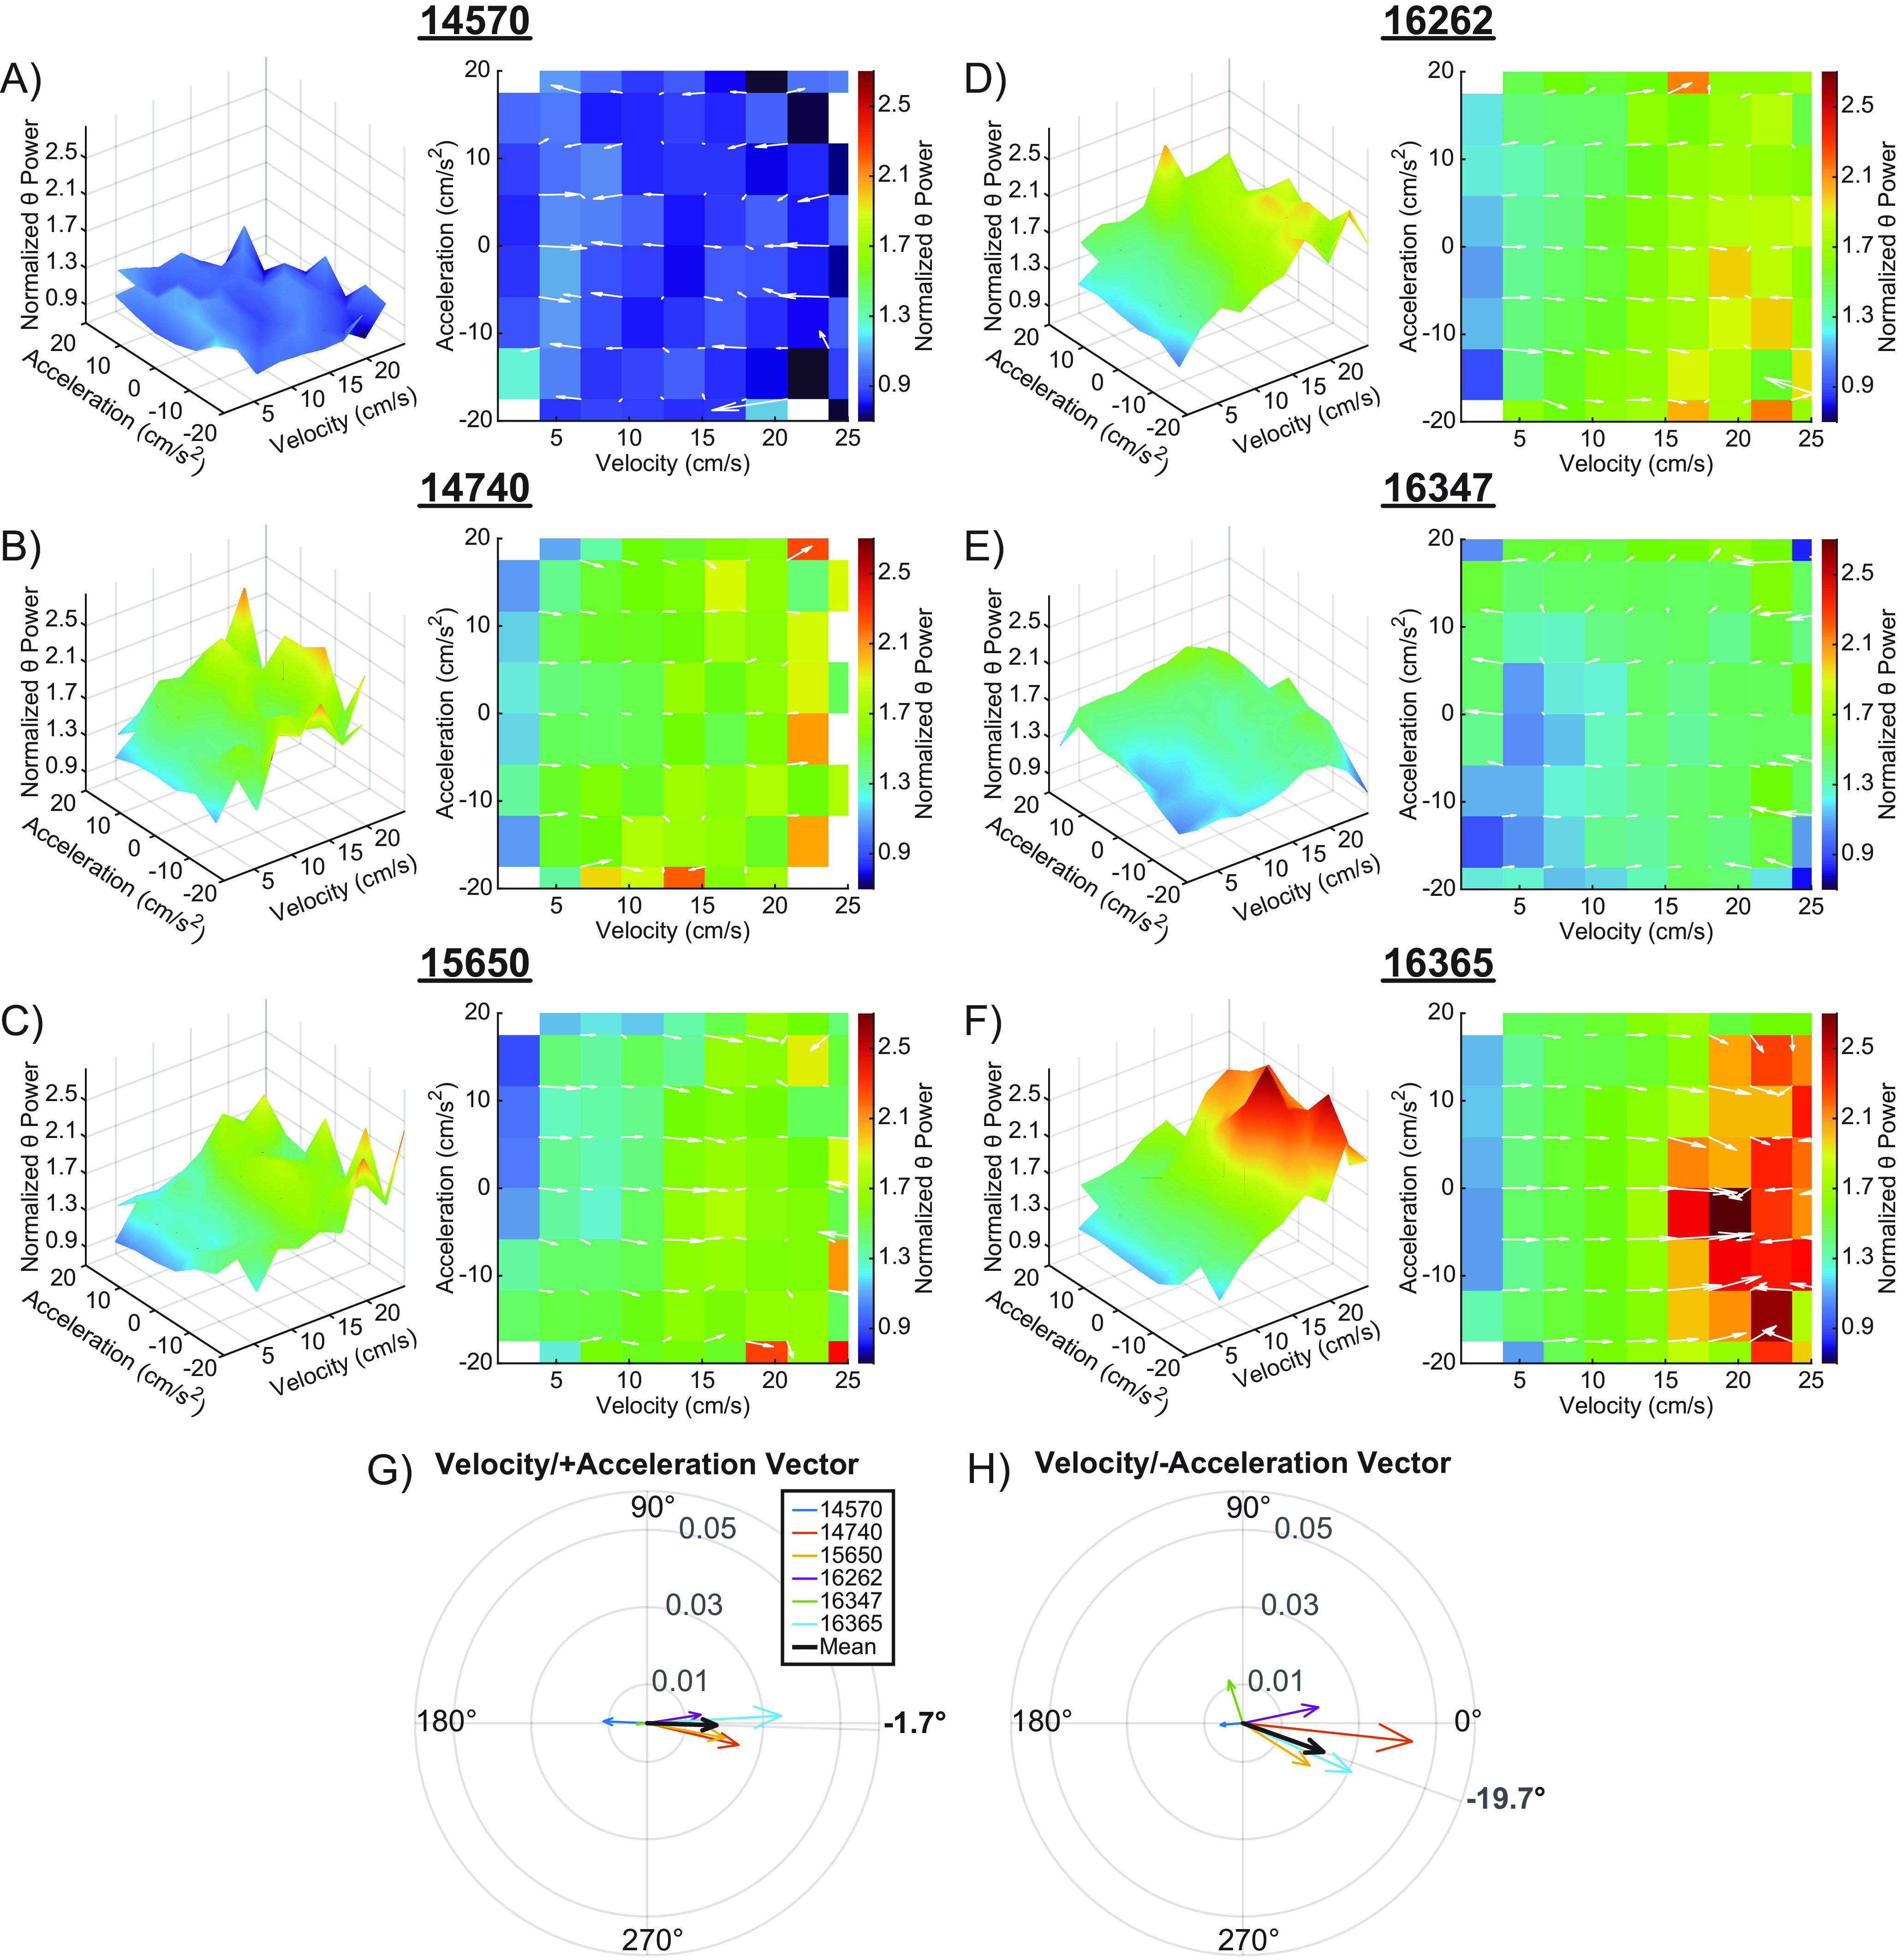
Velocity and acceleration modulation of the theta power in Kropff et al. (2021a). A–F, 3D plots showing the interaction between velocity, acceleration, and normalized theta power for six animals from Kropff et al. (2021a; left), and the corresponding 2D figures representing the top-down view of the 3D surface (right). Overlaid white arrows show the direction and magnitude of the local slope. A robust linear regression was fit to a plot of theta power versus velocity for LFP data from the hippocampal recording from each rat. The y-intercept given by the model was used to normalize theta power. G, H, Compass plots showing the average of the slope vectors (white arrows). An average vector was generated for both the positive (G) and negative acceleration (H) halves of each plot. The average of each animal is shown in various colors, with the mean shown in black. The angle of the set means are shown in bold outside of each compass plot. Note that vector angles close to 0° indicate that theta power was primarily modulated by velocity. As the vector angle increases toward 90°, acceleration makes more of a contribution.
