Figure 4.
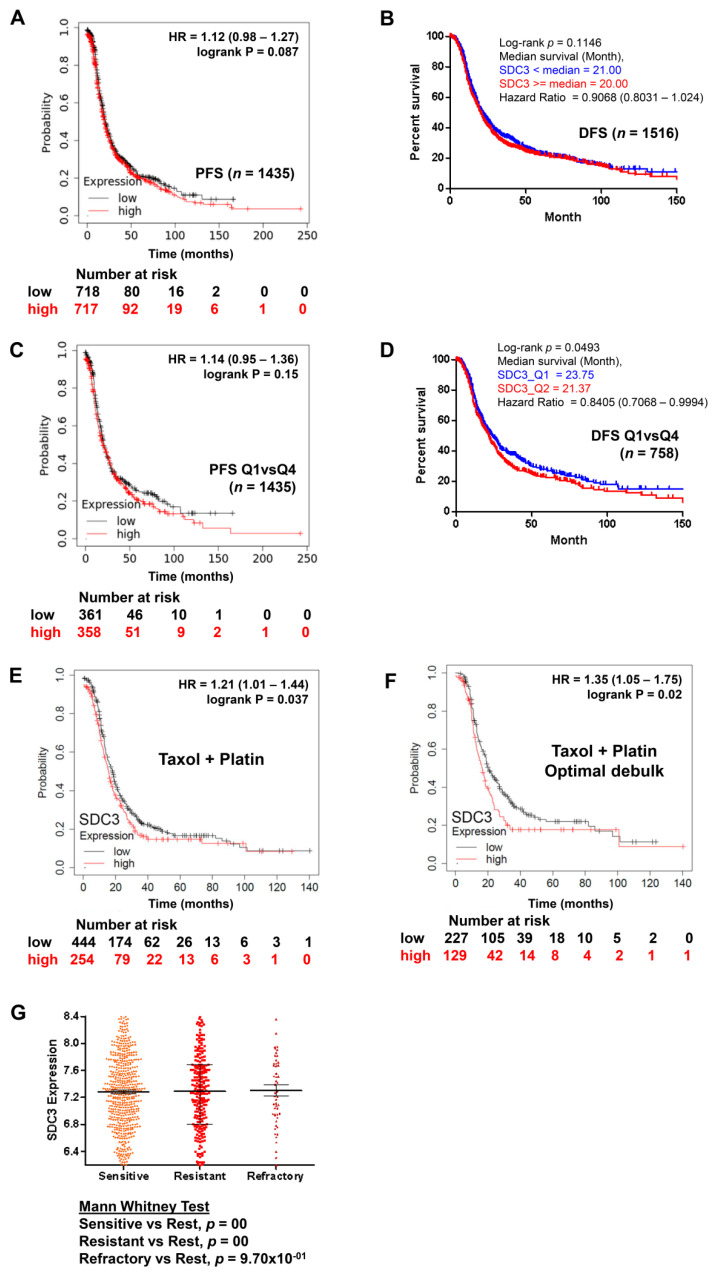
Kaplan–Meier survival analysis. (A) all patients, (C) Quartile 1 and Quartile 4 expression of SDC3 in ovarian cancer patients. (E) Ovarian cancer patients with high compared with low SDC3 mRNA expression in tumor tissue in patients subjected to Taxol and platinum chemotherapy (p = 0.037, hazard ratio (HR) = 1.21) showed a worse survival of (F) shows the patient subgroup with Taxol and platinum chemotherapy and optimal debulking (p = 0.02, HR = 1.35). (A,C,E,F) Data were retrieved from the KM Plotter database [27], which combines public gene expression data based on Affymetrix gene array analyses of 1435 ovarian cancer patients in the GEO and TCGA datasets. The default threshold settings of the KM Plotter tool and a 180-month follow-up were selected for the analysis. (B,D,G) Data were retrieved from the CSIOVDB database [28], retrieved on 26 March 2022. (B) All patients, (D) Quartile 1 (blue) and Quartile 4 (red) expression of SDC3 in ovarian cancer patients. (G) SDC3 expression and chemotherapy response. Mann–Whitney test was performed to evaluate statistical significance.

