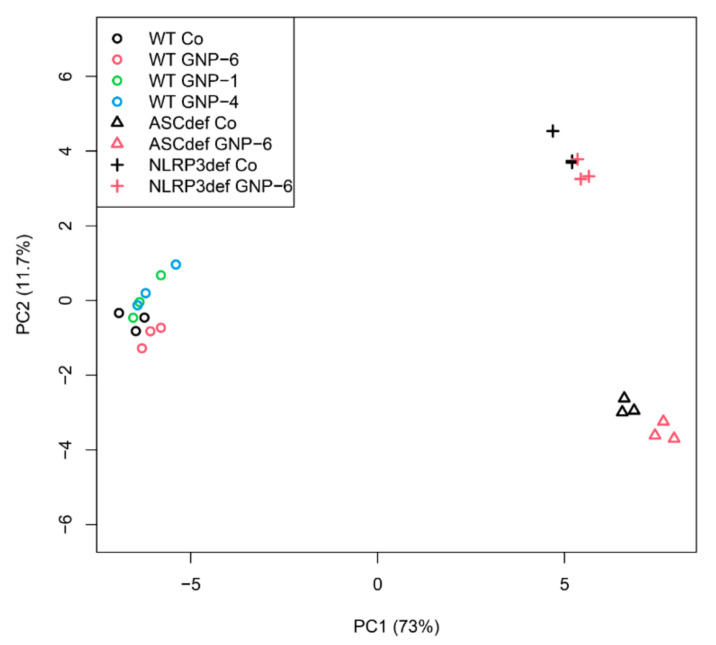
Figure 5.
Principle Component Analysis (PCA) plot of DEGs. The axes represent the dimensions of the largest (principal component 1 (PC1); in this case 73%) and the second largest (PC2; in this case, 11.7%) variation between the samples. All DEGs from Table 3 were used as input data. The numbers at the X- and Y-axes are arbitrary units. Co: unexposed controls.

