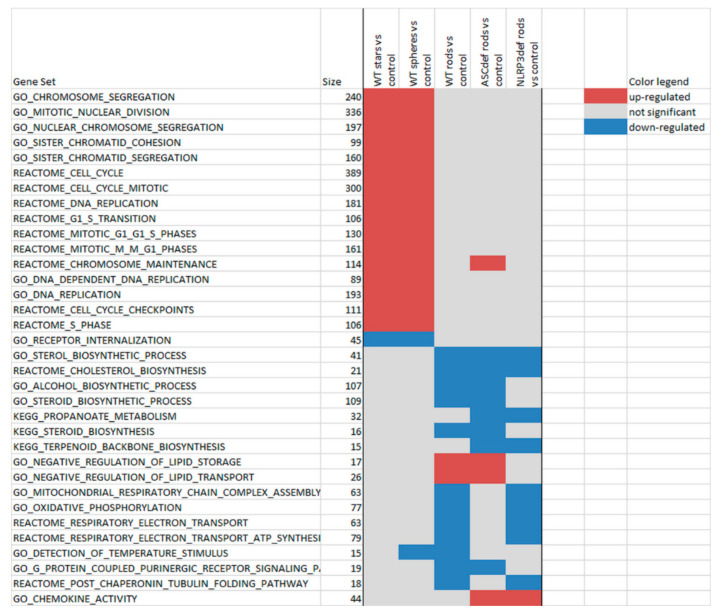
Figure 7.
Gene Set Enrichment Analysis. The pathway selection is based on pathways that are significant (p < 0.001) multiple times, as well as in the top 20 per exposure multiple times. Red: upregulated; blue, downregulated; no colour: not significantly altered. Size: number of genes on the microarray (for a specific pathway). The pathways were ordered (1) based on the response and (2) alphabetically within each type of response.

