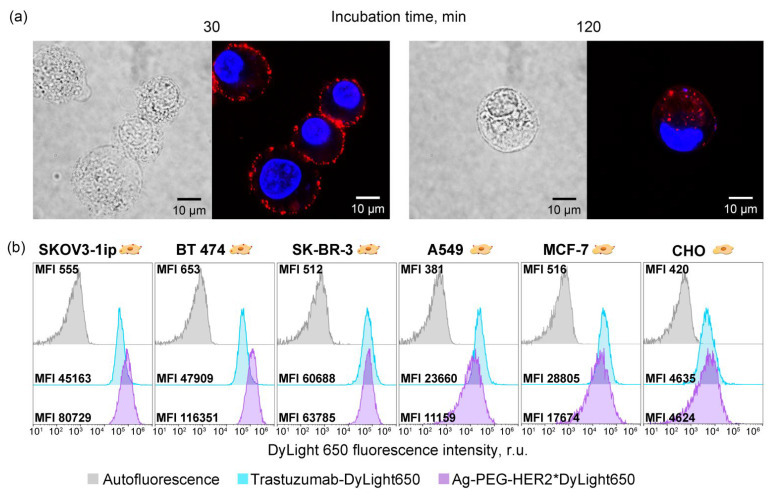
Figure 5.
Imaging modalities of Ag-PEG-HER2 nanoparticles. (a): Visualization of the internalization of Ag-PEG-ZHER2:342 NPs in SKOV3-1ip cells after incubation for 30 (left panels) and 120 (right panels) min using two-channel confocal microscopy. Cell nuclei are stained with Hoechst33342 (blue), and NPs are labeled with DyLight650 (red). (b): Flow cytometry histograms of SKOV3-1ip, BT474, SK-BR-3, A549, MCF-7, and CHO cells showing the cell interaction with Trastazumab-DyLight650 and Ag-PEG-HER2*DyLight650. Gray—cell autofluorescence; blue—cells labeled with Trastuzumab; and violet—cells labeled with Ag-PEG-HER2*DyLight650 nanoparticles.

