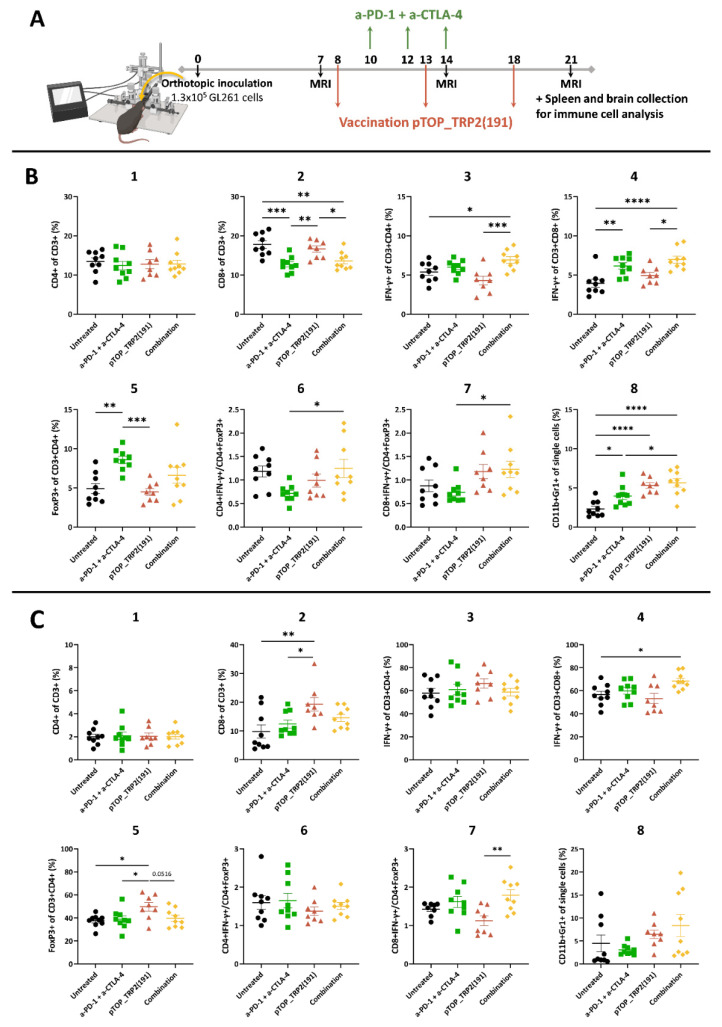
Figure 3.
Immune cell populations analysis in the spleens and brains 21 days after tumor implantation. (A) Schematic protocol of experiments. Timing is expressed in days. (B) FACS analysis of immune cells in the spleens on day 21. (C) FACS analysis of immune cells in the brains on day 21. Values are mean ± SEM; n = 8–9. Statistical analyses were performed using one-way ANOVA with Dunnet’s multiple comparison test (* p < 0.05; ** p < 0.01; *** p < 0.001, **** p < 0.0001, compared to the specified group). Untreated: black circle; anti-PD-1 + anti-CTLA-4: green square; pTOP: red triangle; combination: yellow diamond.

