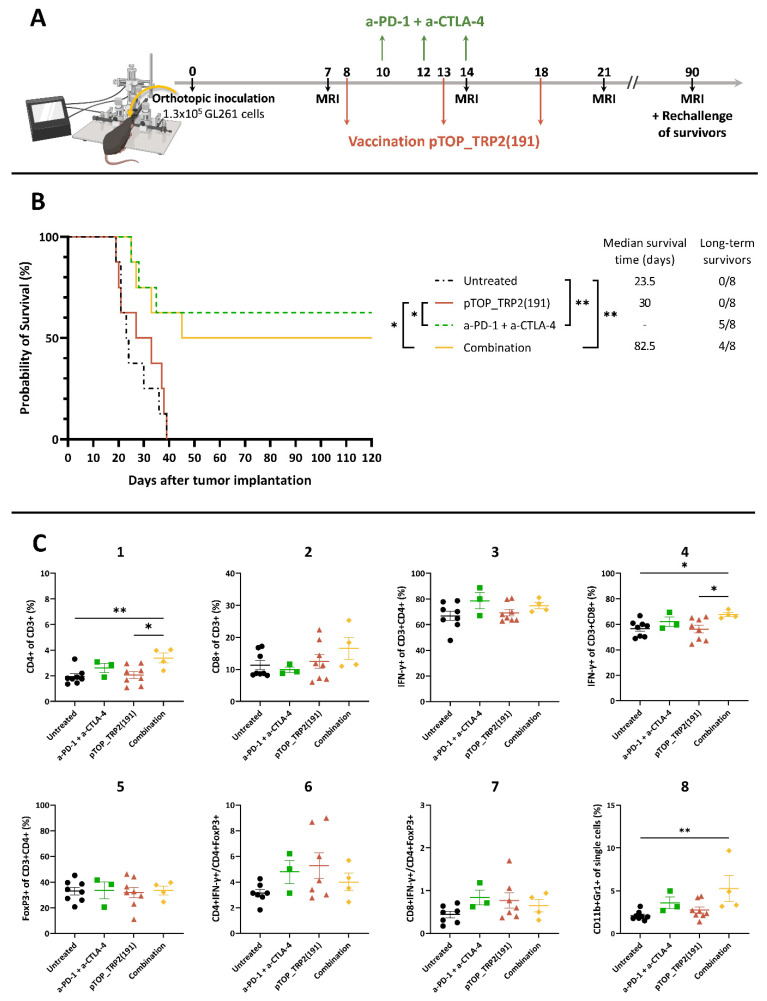
Figure 4.
Survival of GL261-bearing mice following treatment with pTOP, anti-PD-1 and anti-CTLA-4 mAbs or the combination. (A) Schematic protocol of experiments. Timing is expressed in days. (B) Survival curves following treatment with pTOP, ICBs or combination; n = 8. Statistical analyses of survival curves were performed using Mantel–Cox test (* p < 0.05; ** p < 0.01). (C) FACS analysis of immune cells in the brain at endpoints. Values are mean ± SEM; n = 3–8. Statistical analyses were performed using one-way ANOVA with Dunnet’s multiple comparison test (* p < 0.05; ** p < 0.01, compared to the specified group). Untreated: black circle; anti-PD-1 + anti-CTLA-4: green square; pTOP: red triangle; combination: yellow diamond.

