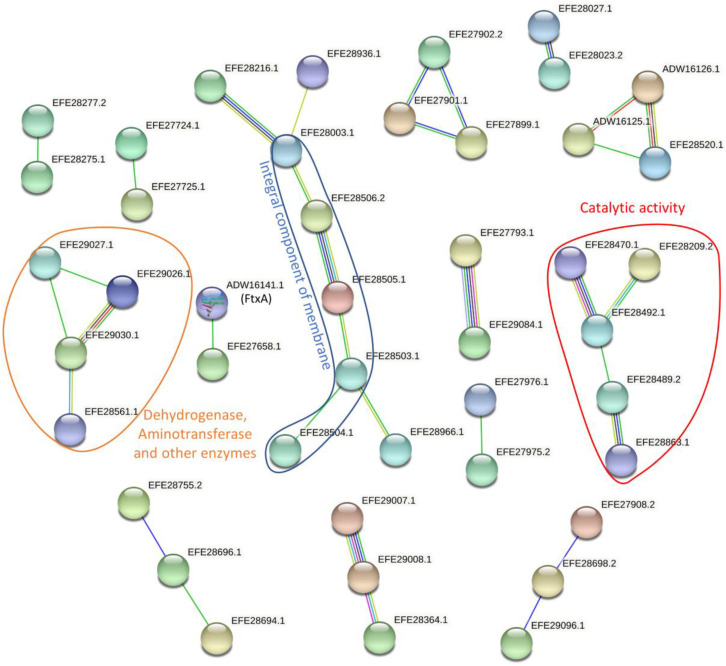
Figure 2.
Protein–protein interactions between regulated proteins. The network established using STRING 10.5 showed protein–protein interactions with a medium confidence score (0.4) (Table S3). The colors of the lines illustrate different types of interactions. Among them, the blue and purple lines indicate interactions based on the curated database and experimental results, respectively, while green, red, dark blue, yellow, and black lines are predicted interactions determined from gene neighborhood, gene fusions, gene co-occurrence, text mining, and co-expression, respectively.

