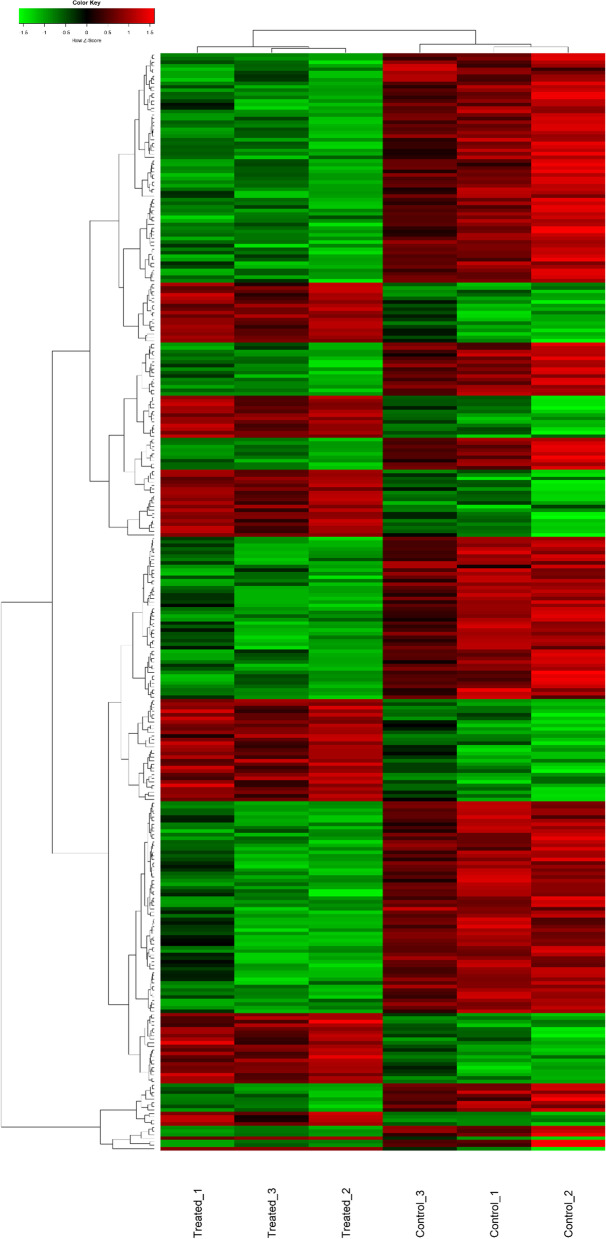
Fig. 7.
Transcriptome (mRNAs) expression profiles of mTEC 3.10 cell line transfected (or not) with miR-155-5p mimic. The mTEC cells total RNA samples were analyzed through microarray hybridizations, which allowed identify the differentially expressed mRNAs including those that encode tissue-restricted antigens (TRAs) or cell migration molecules. The dendrograms and heat-maps were obtained using the cluster and tree view algorithm considering 1.5-fold-change and 0.05 false discovery rate. Data were collected from three independent hybridizations (biological replicates). Heat-map legend: red = upregulation, green = downregulation, black unmodulation (Pearson’s correlation metrics)

