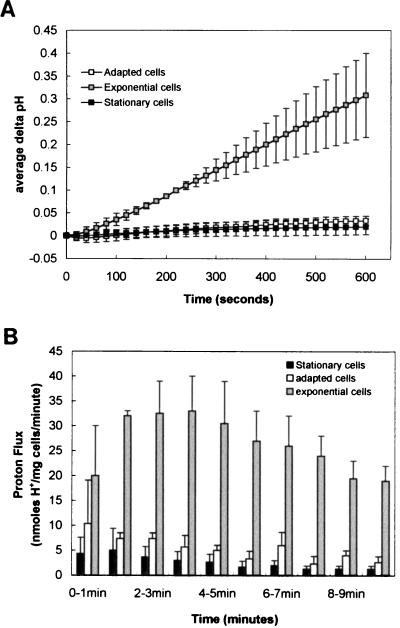
FIG. 4.
Proton flux measurements on cell populations expressing different levels of acid tolerance. Three populations of cells were prepared for analysis as described in Materials and Methods. They were (i) exponential-phase cells without acid adaption (shaded squares and bars), (ii) cells grown to mid-exponential phase and acid adapted at pH 5.0 for 1 h (open squares and bars), and (iii) an overnight culture of stationary-phase cells (solid squares and bars). Proton accumulation measurements were taken over a 10-min period after pulsing cell suspensions with HCl and are shown as either delta pH values (A) or as net proton flux rates in nanomoles of protons per milligram (wet weight) of cells per minute (B).

