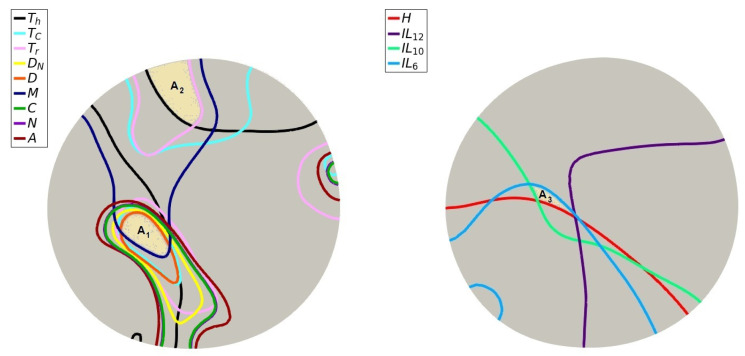
Figure 6.
(Left): Level-curves indicating the mean value of each cell type at . (Right): Level-curves indicating the mean value of each molecule at . Areas and correspond to the regions with the most and second-most immune cell intersections, respectively. Area corresponds to the region with the highest cytokine intersections.

