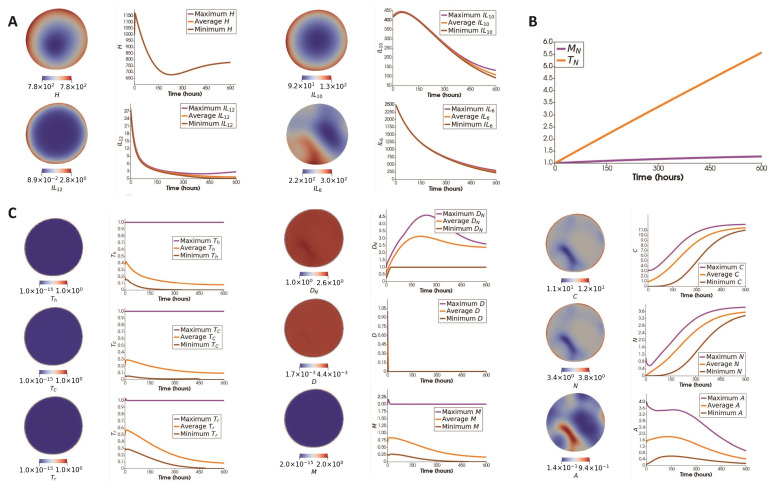
Figure 9.
Results with flux of immune cells. (A) Column 1: Spatial distribution of cytokines. Column 2: Maximum, average, and minimum concentration (ng/mL) of each cytokine over the whole domain with respect to time. (B) Evolution of naive T cells and naive macrophages. (C) Column 1: Spatial distribution of cell types. Column 2: Maximum, average, and minimum number of each cell type over the whole domain with respect to time.

