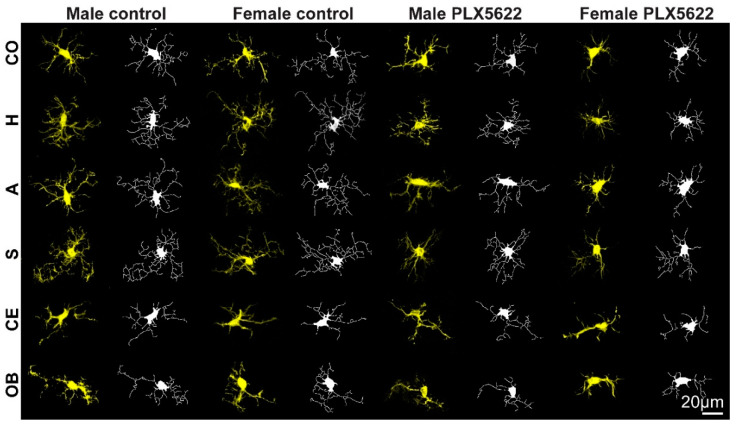
Figure 3.
Maximum intensity projection confocal microscope images (yellow) from different brain regions in control male and female and in rats fed ad libitum for 10 days on PLX5622 chow. These were imported to the HCA-vision software (white) and the microglia cell bodies and extensions were automatically identified and measured. CO—cortex, H—hippocampus, A—amygdala, S—striatum, CE—cerebellum, OB—olfactory bulb (for statistics, see Figure 4 and Supplementary Tables S1 and S2).

