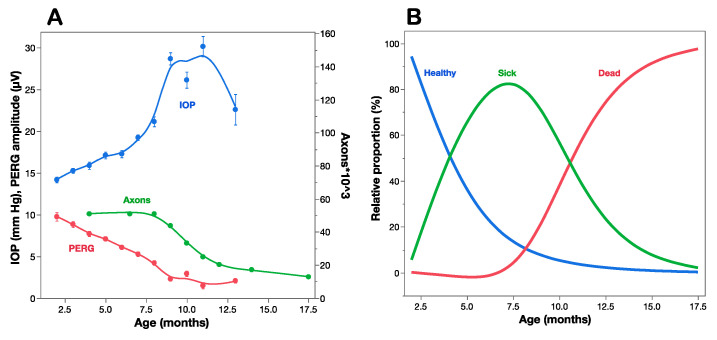
Figure 3.
Structure–function relationships in DBA/2J mice. (A) IOP, PERG amplitude, and optic nerve axon counts as a function of age of mice. (B) Estimated proportion of healthy, sick, and dead retinal ganglion cells at different ages based on a mathematical model that accounts for the structural/functional differences shown in panel (A). (A) replotted from Saleh et al., IOVS 2007; (B) replotted from Porciatti and Chou, Cells 2021.

