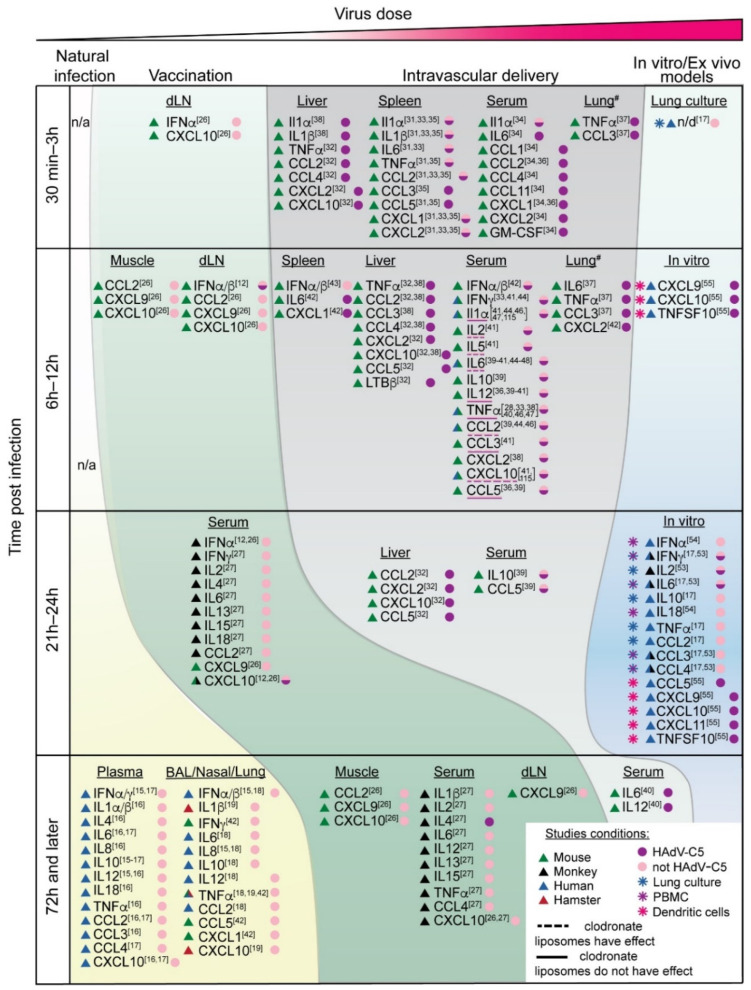
Figure 1.
Cytokine responses to adenovirus in different biological contexts. The four areas are shaded in different colors, indicating adenovirus infection in various routes. The areas are positioned from left to right according to the virus dose received during infection. Vertically, the table is divided into four time periods from the earliest to the later times post infection. The deepest hues of the gradient colors show the peak times of cytokine response. The triangles indicate the species examined in the studies, and the color of the circles shows which adenovirus species were used. dLN—draining lymph node; BAL—bronchoalveolar lavage; n/a—data are not available; n/d—non detected; #—in this study, the virus was delivered intratracheally. The data for individual cytokines and chemokines, reported in references from [12,13,14,15,16,17,18,19,20,21,22,23,24,25,26,27,28,29,30,31,32,33,34,35,36,37,38,39,40,41,42,43,44,45,46,47,48,49,50,51,52,53,54,55,56,57,58,59,60,61,62,63,64,65,66,67,68,69,70,71,72,73,74,75,76,77,78,79,80,81,82,83,84,85,86,87,88,89,90,91,92,93,94,95,96,97,98,99,100,101,102,103,104,105,106,107,108,109,110,111,112,113,114,115], are shown with superscript numbers.

