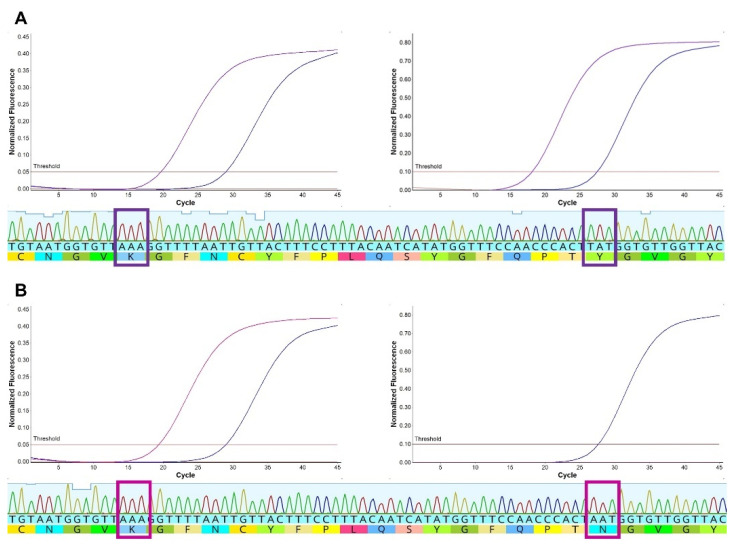
Figure 4.
Spike SNP and amplicon sequencing results were concordant. Amplification curves and amplicon sequence tracings are shown for samples with mutations encoding (A) 484K and 501Y (purple curves) or (B) 484K only with N501 (cranberry). A beta variant control sample is shown for reference (blue curves). Bold squares highlight the SNP mutations in the amplicon sequence.

