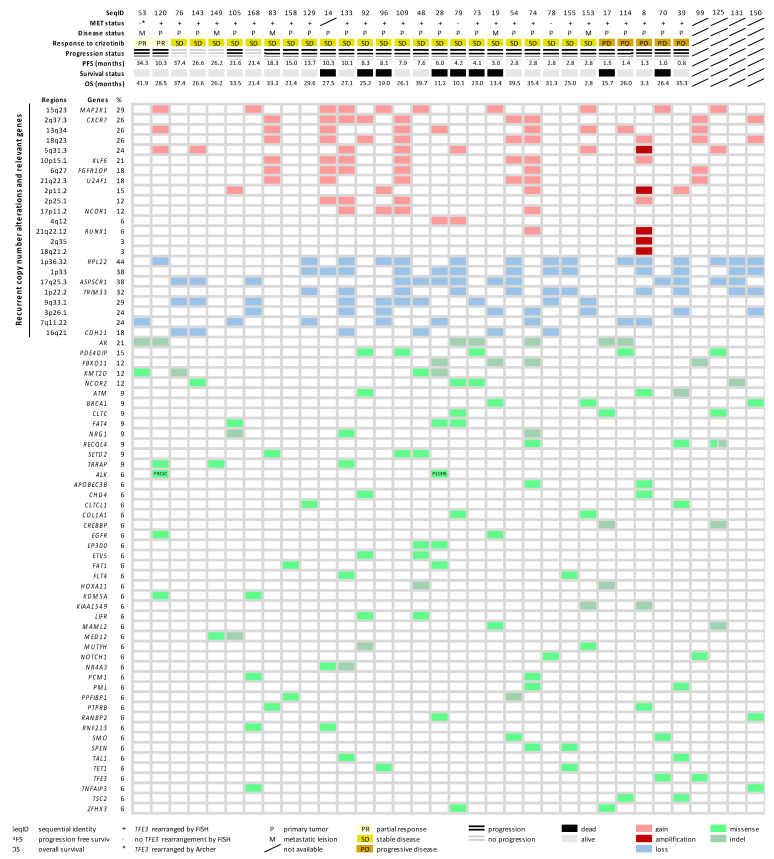
Figure 4.
A summarized heatmap for the gene alteration landscape and trial-related clinical data. Clinical data for each case was listed on the top in the order of response to crizotinib. Types of alterations that affected genomic regions, as well as genes (cancer consensus gene associated genes), were sorted according to frequency. Rows represent individual regions and genes, while columns represent individual cases. Clinical features and types of alterations and are coded in different colors (bottom).

