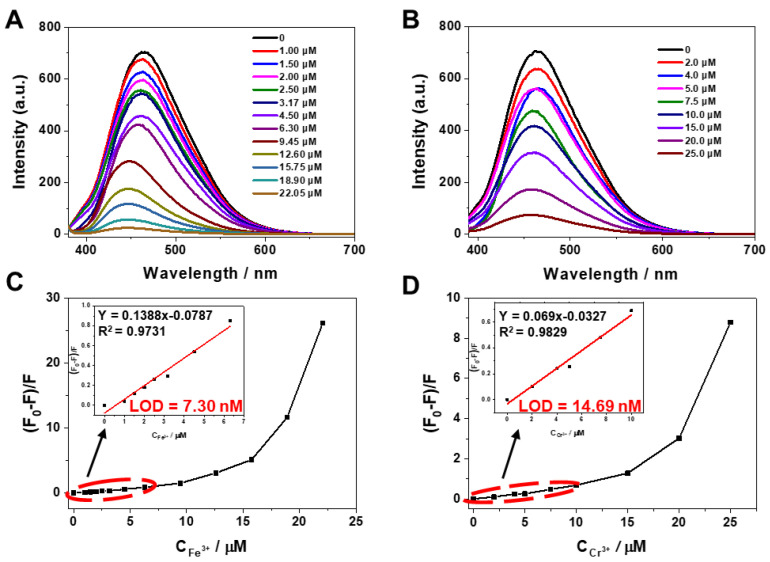
Figure 7.
Fluorescence spectra of P1 quenched by various amounts of (A) Fe3+ (ranging from 0 to 22.05 μM) and (B) Cr3+ (ranged from 0 to 25.00 μM) in THF. Additionally, the plots of the relative intensity of fluorescence ((F0 − F)/F) versus the Fe3+ and Cr3+ concentrations are shown in (C) and (D), respectively.

