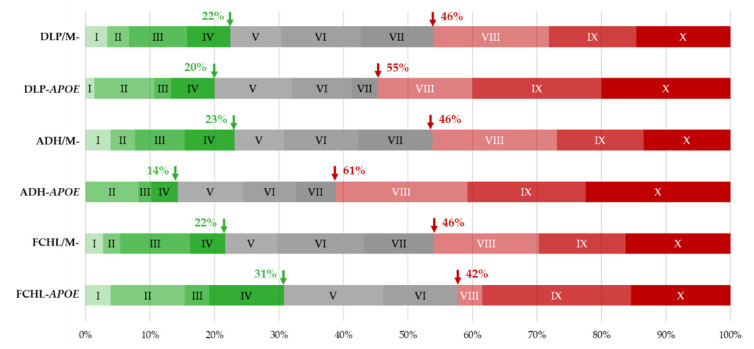
Figure 2.
Distribution of the 12-SNP weighted polygenic risk score (wPRS) within the deciles of the Whitehall II control cohort [7]. Comparison between dyslipidemic (DLP = ADH/FCHL), ADH, or FCHL probands carrying an APOE rare variant or without any ADH/FCHL causative mutation (/M-). Green arrows indicate the percentage of probands with a low wPRS and a probability of monogenic DLP that gradually increases under decile V. Red arrows indicate the percentage of probands with a wPRS in the top three deciles with a high probability of polygenic DLP.

