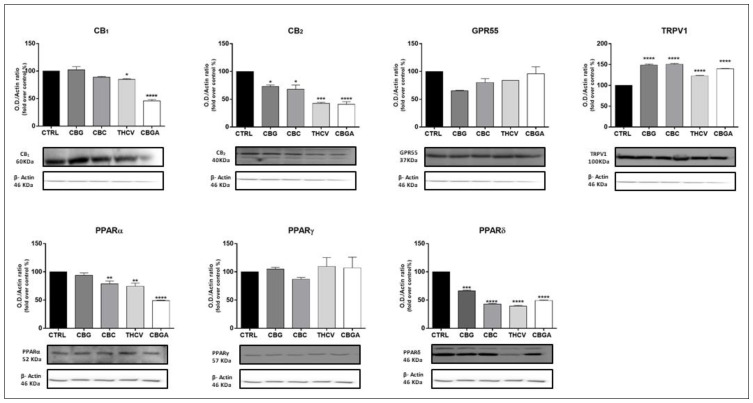
Figure 4.
Protein expression of eCB-binding receptors (CB1, CB2, GPR55, TRPV1 and PPARα/γ/δ) following 24 h of treatment with half-IC50 amounts of: CBG, CBC, THCV and CBGA. Densitometric analyses of eCB-binding receptors immunoreactive bands were normalized to β-actin as the housekeeping protein and were presented as fold change over control (%). The data are the means ± SEM of three independent experiments (n = 3). Statistical analysis was performed using a one-way ANOVA test, followed by the Bonferroni post hoc test (* p < 0.05, ** p < 0.01, *** p < 0.001 and **** p < 0.0001 vs. control).

