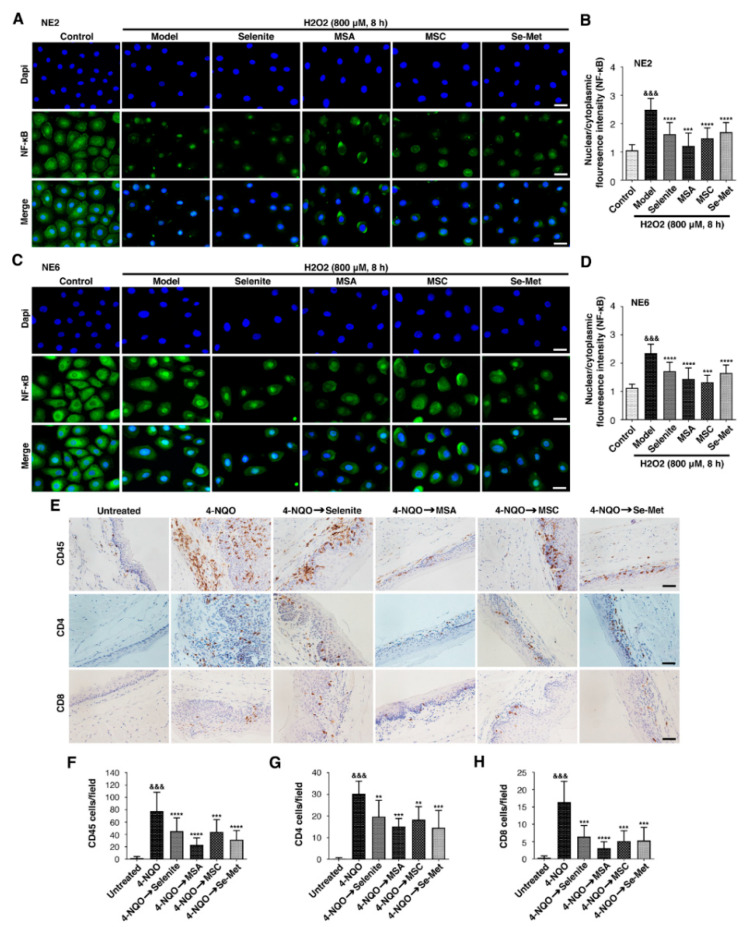
Figure 4.
Selenium impedes inflammation in esophageal immortalized epithelial cell lines and 4-NQO mice model. Cells (NE2 and NE6) were pre-treated with selenium compounds, selenite (6 µM), MSA (2 µM), MSC (100 µM), and Se-Met (100 µM) for 2 h and then co-cultured with (800 µM) H2O2 for 8 h. NF-κB expression was visualized by immunofluorescence using primary specific antibodies and Alexa Fluor 488-conjugated secondary antibodies. Nuclei were stained with DAPI. (A) Representative images of NF-κB fluorescence in NE2 cell line. (B) The image analysis of NF-κB fluorescence data shows the nuclear to cytoplasmic staining ratio for each treatment in the NE2 cell line. (C) Representative images of NF-κB fluorescence in NE6 cell line. (D) The image analysis of NF-κB fluorescence data shows the nuclear to cytoplasmic staining ratio for each treatment in the NE6 cell line. The nuclear/cytoplasm fluorescence intensity per cell was determined by counting at least 100 cells on 10 fields randomly selected for each sample. Differences are significant at (&&& p < 0.001 vs. untreated group, *** p < 0.001, **** p < 0.0001 vs. H2O2 group, n ≥ 3). Data are expressed as mean ± SD from three (n = 3) independent experiments. (Magnification, ×40; scale bar = 20 μm.) Selenium compounds, selenite (0.05 mg/kg), MSA (0.05 mg/kg), MSC (0.1 mg/kg), Se-Met (0.1 mg/kg) were administered for 4 weeks of post-completion and for 16 weeks of 4-NQO exposure. The mice were sacrificed, and the esophagus sections were fixed, embedded in paraffin, and sectioned. Then, the tissue sections were stained with CD45, CD8, and CD4 antibodies. Four to five representative areas of each esophagus section from each mouse were photographed and analyzed per group. (E) Representative immunohistochemical staining of CD45, CD4, and CD8 for each treatment group. (F) Numerical analysis of CD45-positive cells for each treatment group. (G) Numerical analysis of CD4-positive cells for each treatment group. (H) Numerical analysis of CD8 for each treatment group. Differences are significant at (&&& p < 0.001 vs. untreated group, ** p < 0.01, *** p < 0.001, **** p < 0.0001 vs. 4-NQO group). A difference with p ≤ 0.05 was considered statistically significant. (Magnification, ×400; scale bar = 40 μm.).

