Figure 5.
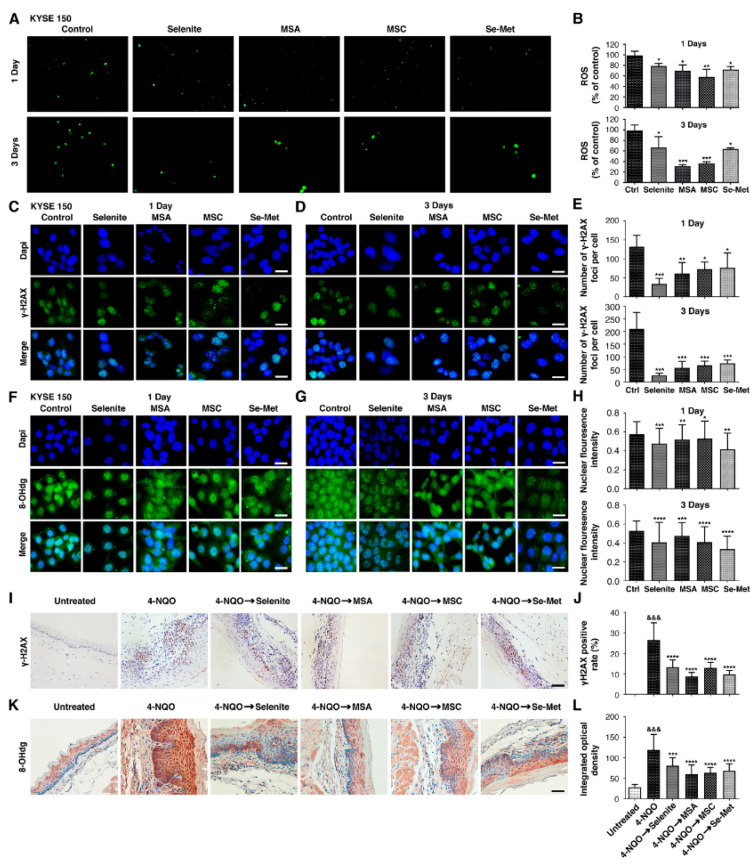
Selenium diminishes intracellular ROS levels and oxidative DNA damage in ESCC. Cells were treated with selenite—(6 µM), MSA (2 µM), MSC (100 µM), and Se-Met (100 µM)—for 1 and 3 days. (A) The level of intracellular ROS in KYSE 150 cells was stained by DCFH-DA and observed under Zeiss Vert A1 fluorescence microscope. (B) Statistical results were read by fluorescent plate reader in KYSE 150 cells. γ-H2AX expression and 8-OHdg expression were visualized by immunofluorescence using primary specific antibodies and Alexa Fluor 488-conjugated secondary antibodies. Nuclei were stained with DAPI. (C,D) Representative images of γ H2AX immunostaining after 1 day and 3 days in KYSE 150. (E) Columns represent the number of γ-H2AX foci/cell for each treatment after 1 day and 3 days in KYSE 150. (F,G) Representative images of 8-OHdg immunostaining after 1 day and 3 days in KYSE 150. (H). Histograms show nuclear fluorescence intensity signal quantification in the nuclei of each treatment after 1 day and 3 days in KYSE 150. Differences are significant at (* p < 0.05, ** p < 0.01, *** p < 0.001, **** p < 0.0001 vs. untreated control, n ≥ 3). Data are expressed as mean ± SD from three (n = 3) independent experiments. (Magnification, ×40; scale bar = 20 μm.) Selenium compounds, selenite (0.05 mg/kg), MSA (0.05 mg/kg), MSC (0.1 mg/kg), and Se-Met (0.1 mg/kg) were administered for 4 weeks of post-completion and 16 weeks for 4-NQO exposure. The mice were sacrificed, and the esophagus sections were fixed, embedded in paraffin, and sectioned. Then, the tissue sections were stained with γ-H2AX and 8-OHdg antibodies. Four to five representative areas of each esophagus section from each mouse per group were photographed and analyzed. (I) Immunohistochemical staining of γ-H2AX for each treatment group. (J) Statistical analysis of γ-H2AX-positive cells for each treatment group. (K) Fluorescence microscopy images of 8-OHdg immunostaining for each treatment group. (L) Statistical analysis of IOD of 8-OHdg immunostaining for each treatment group. Differences are significant at (&&& p < 0.001 vs. untreated group, *** p < 0.001, **** p < 0.0001 vs. 4-NQO group). The difference with p ≤ 0.05 was considered statistically significant. (Magnification, ×400; scale bar = 40 μm.).

