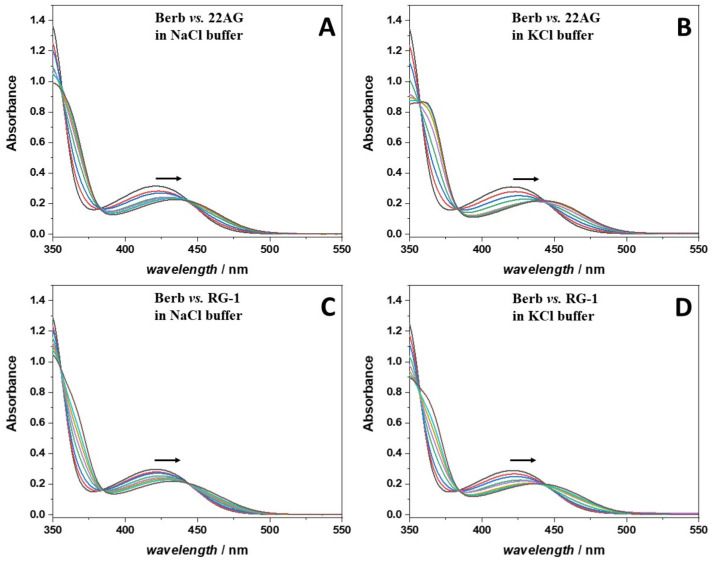
Figure 2.
UV/Vis absorption spectra of a 250 µM berberine (Berb) solution at increasing concentrations of: (A) 22AG in Na+ containing buffer; (B) 22AG in K+ containing buffer; (C) RG-1 in Na+ containing buffer, and (D) RG-1 in K+ containing buffer. The concentration of the quadruplexes (22AG or RG-1) was: 10 µM (red lines), 20 µM (blue lines), 40 µM (green lines), 60 µM (violet lines), 80 µM (dark yellow lines), 100 µM (cyan lines), and 150 µM (brown lines). The spectra of berberine in the absence of any quadruplex are reported as black lines. All spectra were recorded at 25 °C using a 0.3 cm path length quartz cuvette in 30 mM Tris buffer, pH 7.4, with the addition of 100 mM of NaCl or KCl. The arrows indicate the direction of the shift of the absorption maximum in the berberine spectrum with increasing concentrations of G4Qs.

