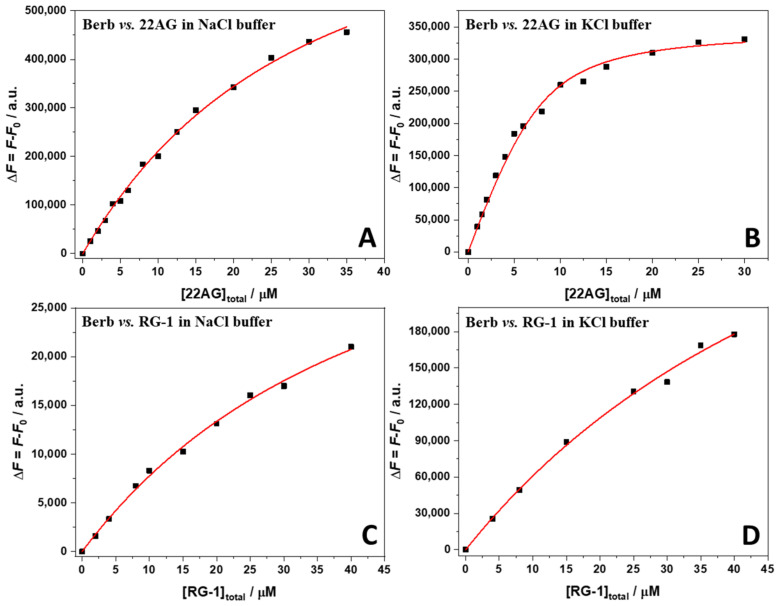
Figure 4.
Binding isotherms for the Berb/22AG (panel (A,B)) and Berb/RG-1 (panel (C,D)) systems obtained from fluorescence spectroscopy in 30 mM Tris buffer, pH 7.4, with the addition of 100 mM NaCl or KCl. The berberine concentration was 15 µM and the concentration of G4Qs was varied between 0 µM and 40 µM. The berberine was excited at 443 nm, the emission was collected at the maximum of emission, at 536 nm. The red lines represent the best fit of the experimental data according to an equivalent and independent binding sites model. According to the Job’s plot data, the stoichiometry was 2:1 (Berb:G4Q) in all cases. All the experiments were performed at 25 °C and 1 bar.

