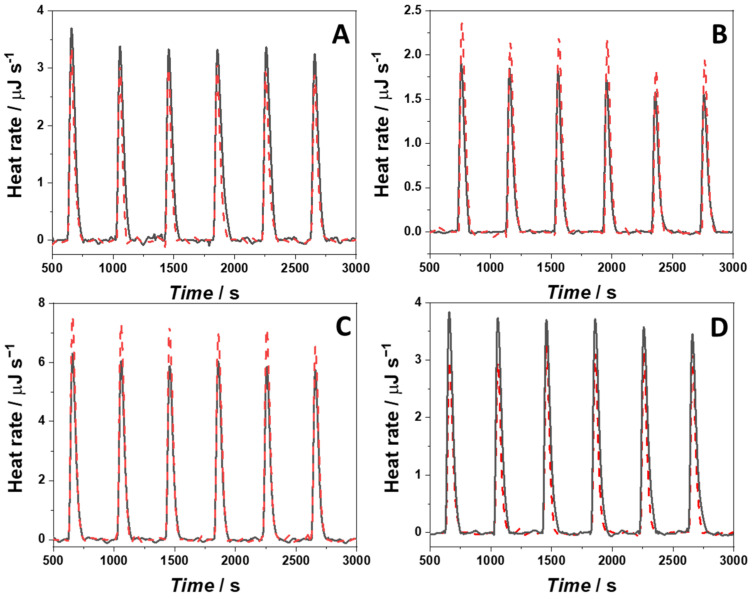
Figure 5.
ITC traces (black lines) obtained from the titration of a solution of (A) 22AG in the presence of 100 mM NaCl, (B) 22AG in the presence of 100 mM KCl, (C) RG-1 in the presence of 100 mM NaCl, and (D) RG-1 in the presence of 100 mM KCl, with a solution of berberine. The red dashed lines represent the heat peaks obtained from the G4Q dilutions in the respective buffers. All the experiments were carried out in 30 mM Tris-HCl buffer, pH 7.4, at the temperature of 25 °C.

