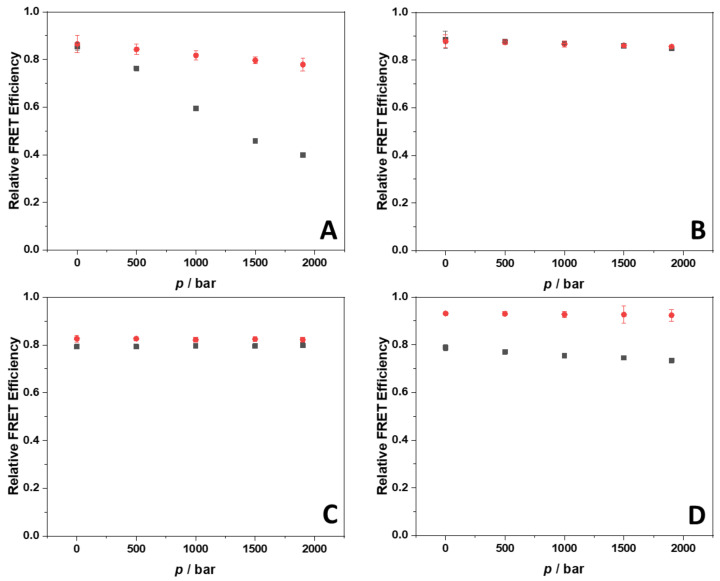
Figure 7.
Relative FRET efficiency vs. pressure plots for the dually labeled 22AG (panels (A,B)) and RG-1 (panels (C,D)) quadruplex forming sequences in the absence (black squares) and in the presence (red circles) of berberine in 30 mM Tris buffer, pH 7.4, with the addition of 100 mM NaCl (panels (A,C)) and 100 mM KCl (panels (B,D)). The concentration of the labeled G4Q sequences was 2 µM, the concentration of berberine was 200 µM. All the experiments were performed at the temperature of 25 °C. Where not visible, the error bars are smaller than the symbol size.

