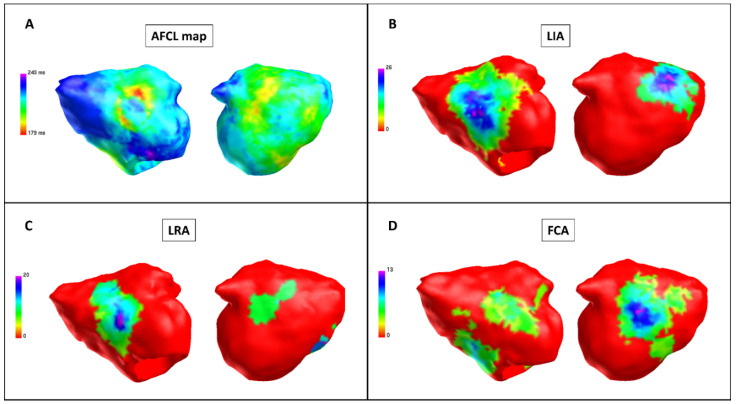
Figure 2.
Charge density map after pulmonary vein isolation (Patient 9). Charge density map with the AcQmapTM catheter. Each color point on the map corresponds to the color-matched legend on the left. (A) Atrial fibrillation cycle length (AFCL) map: left side, anterior-posterior view; right side, posterior-anterior view. When compared with baseline, the AFCL is higher in the posterior region; there is no area of a short AFCL in the anterior region. Color bar describes AFCL in ms. (B) LIA map: left side, anterior-posterior view; right side, posterior-anterior view. Higher LIA number in the anterior and posterior regions. Color bar describes LIA in LIA/s. (C) LRA map: left side, anterior-posterior view; right side, posterior-anterior view. Higher LRA number in the anterior and posterior regions. Color bar describes LRA in LRA/s. (D) FCA map: left side, anterior-posterior view; right side, posterior-anterior view. Higher FCA number in the anterior and posterior regions. Color bar describes FCA in FCA/s. FCA: focal centrifugal activation; LIA: localized irregular activation; LRA: localized rotational activation.

