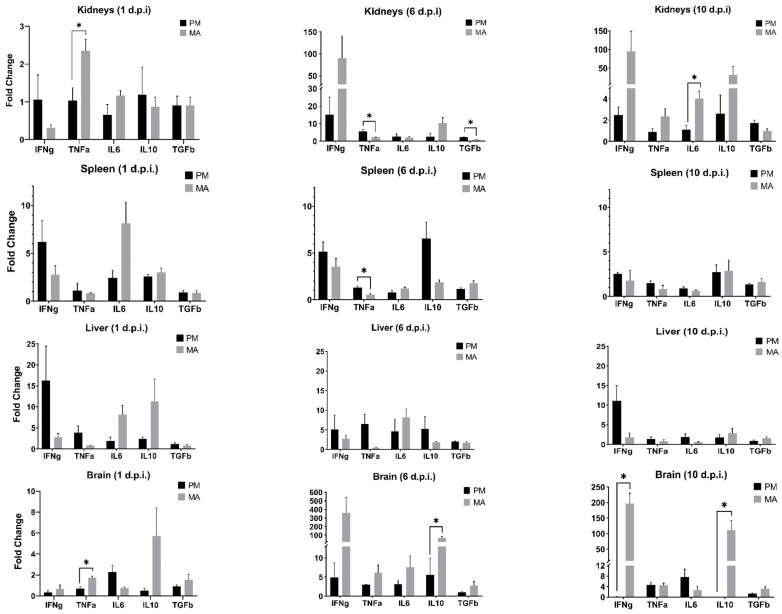
Figure 3.
Cytokine gene expression levels as detected by RT-qPCR in select tissues from Peromyscus maniculatus (PM) and Mesocricetus auratus (MA). Each timepoint reflects the mean relative expression levels from infected replicates (n = 3) of each species. Bars with asterisks (*) denote a significant difference in the expression levels between species at that collection timepoint (uncorrected for multiple tests).

