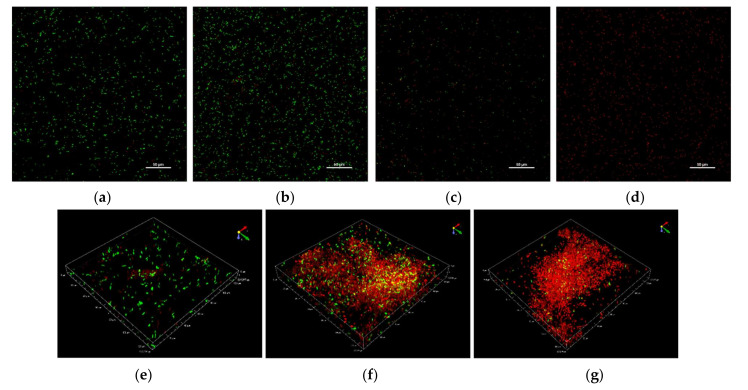
Figure 2.
Representative CLSM images of L. monocytogenes ATCC 7644 cells exposed to CHY concentrations for 1 h at 37 °C. Control sample (a), 250 µL mL−1 (b), 350 µL mL−1 (c), and 500 µL ml−1 (d) of CHY. Cellular aggregation in presence of 250 µL mL−1 (e), 350 µL mL−1 (f), and 500 µL ml−1 (g) of CHY.

