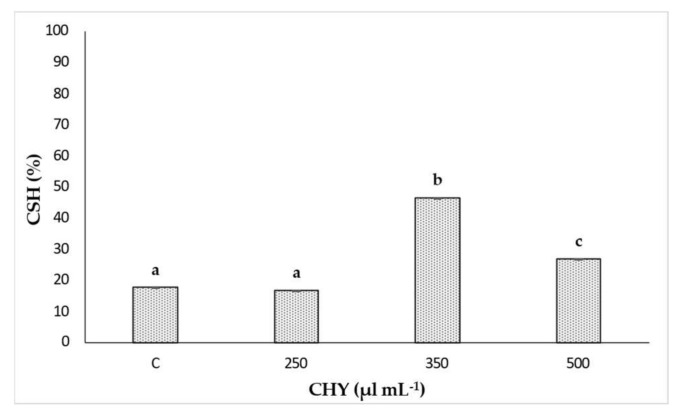
Figure 4.
Cell surface hydrophobicity (%CSH) values observed for L. monocytogenes ATCC 7644 after exposure to 250, 350 and 500 µL mL−1 of CHY for 1 h at 37 °C. Control (C) corresponds to the untreated sample. Results are means of three biological repetitions and the bars indicates the standard deviations. Different letters indicate significant differences (p < 0.05) on %CSH among treatments with three CHY concentrations.

