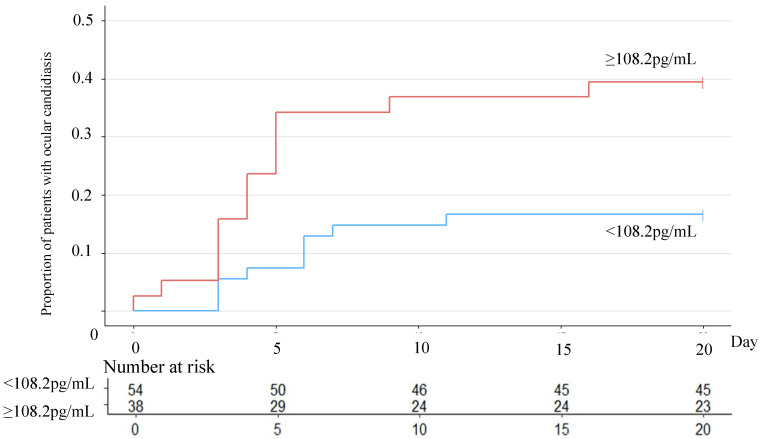
Figure 2.
Kaplan−Meier curve showing the proportion of patients with ocular candidiasis in two groups determined by β-D-glucan levels. ROC curves were created for the presence of ocular lesions, and the Youden index was calculated to be 108.2. Based on this β-D-glucan value, cases were divided into two groups. The log-run test was statically significant at p < 0.05.

