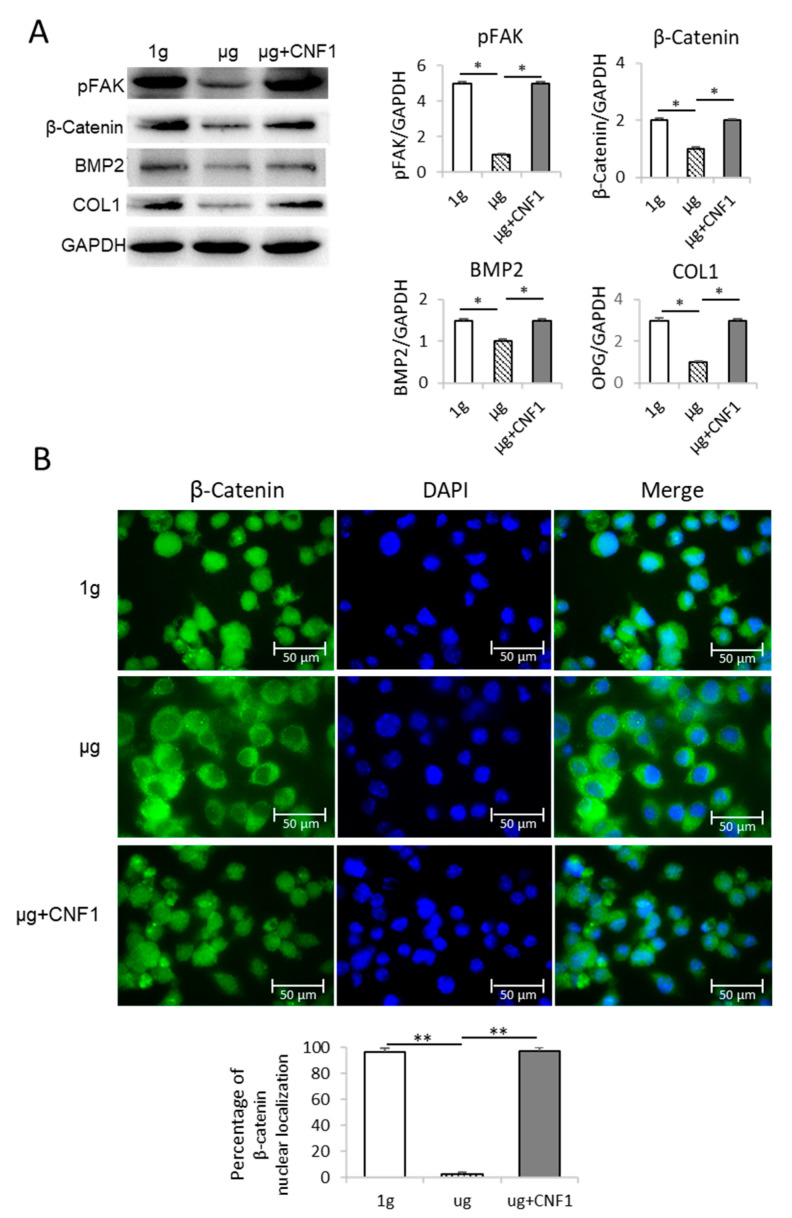
Figure 2.
Analysis of FAK and Wnt/β-catenin-regulated gene signaling and β-catenin nuclear localization in MC3T3-E1 cells cultured under different conditions. (A) Cell lysates prepared from MC3T3-E1 cells cultured in flasks under 1 g, μg and μg + CNF1 were subjected to SDS-PAGE analysis, respectively. Proteins were transferred onto PVDF membranes and blotted with indicated antibodies. Western blot band signals were quantified by chemiluminescence. Densitometric values were normalized for matching GAPDH controls. Data represent the mean ± SD of three replicates. * p < 0.05 versus different groups by Student t test. (B) β-catenin nuclear localization analysis. MC3T3-E1 cells grown on chamber slides were covered using Prolong Gold Antifade Reagent with DAPI (blue) and observed by confocal microscopy. The percentages of β-catenin nuclear localization were measured by using ImageJ software. Data represent the mean ± SD. ** p < 0.01 versus different groups by using Student t test. One representative experiment of two is shown.

