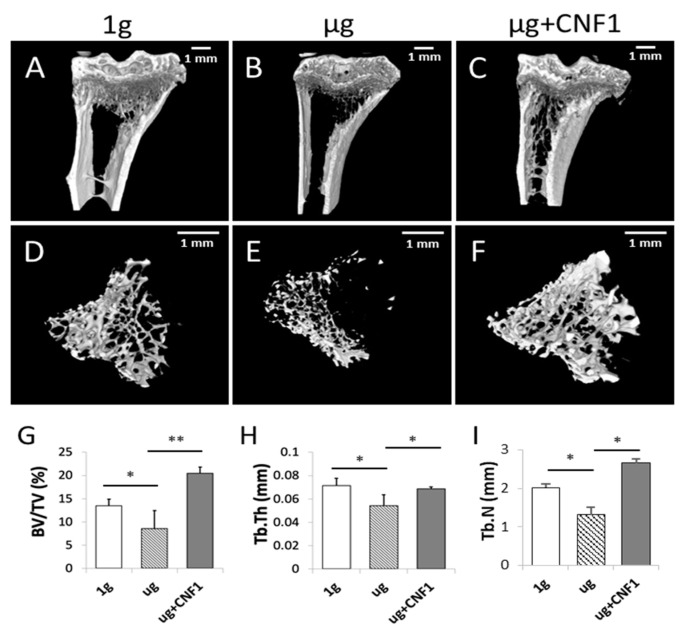
Figure 4.
Measurement of mouse proximal trabecular structures by micro-CT imaging in HU-treated (n = 5), HU + CNF1-treated (n = 4) and control (n = 8) mice. (A–F) Micro-CT showed that HU-treated mice had significantly less trabecular bone formation than the control mice and that HU+CNF1-treated mice effectively converted HU-inhibited trabecular bone formation. (G–I) Bone volume fraction (BV/TV), trabecular thickness (Tb.Th) and trabecular number (Tb.N) all significantly decreased in tibias of HU-treated mice compared to control mice, and activation of FAK restored HU-affected trabecular bone formation. Scale bar: 1 mm. Data represent the mean ± SD. * p < 0.05 and ** p < 0.01 versus different groups by Student t test.

