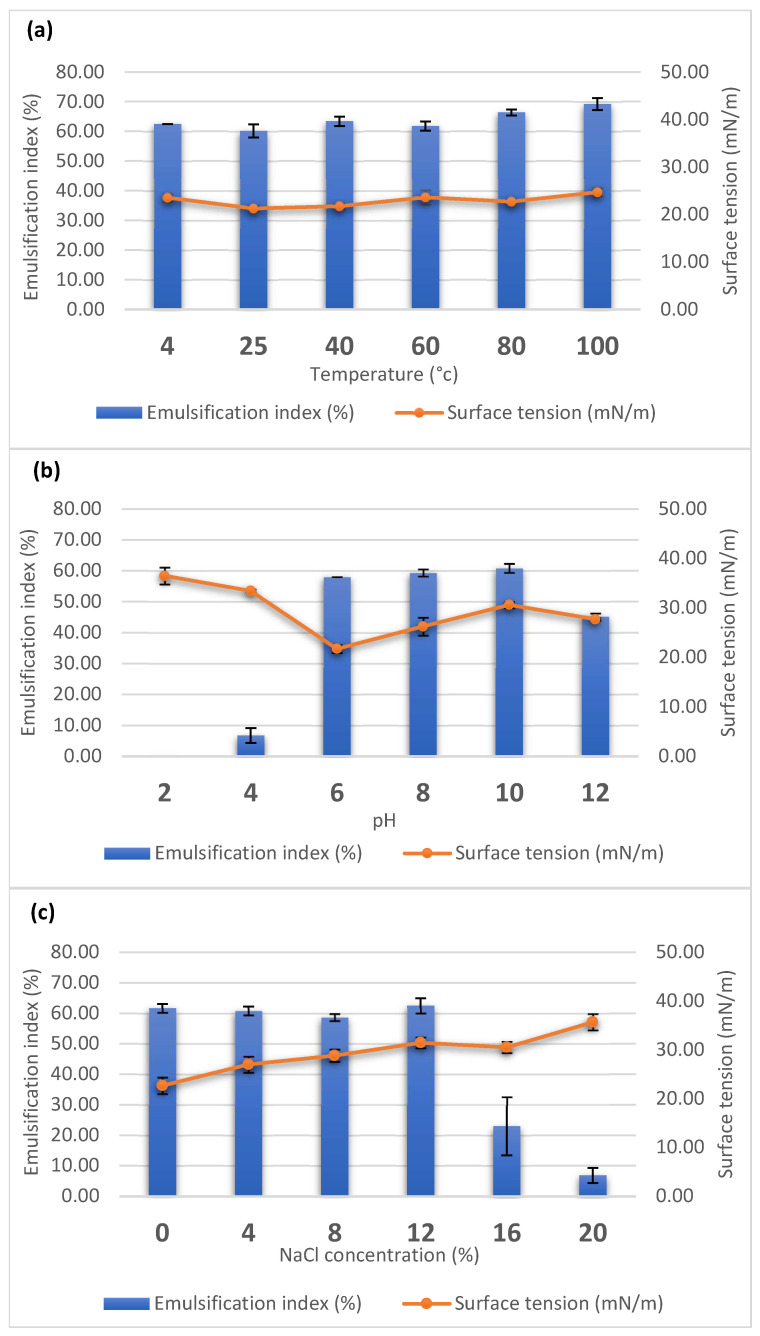
Figure 2.
Effect of temperature (a), pH (b), and NaCl concentration (c) on the emulsifying index (%) and surface tension (mN/m) of PW192 biosurfactant. The bar and line plots represent emulsification index and surface tension, respectively. Data presented are the average of triplicate experiments, and error bars indicate standard deviation.

