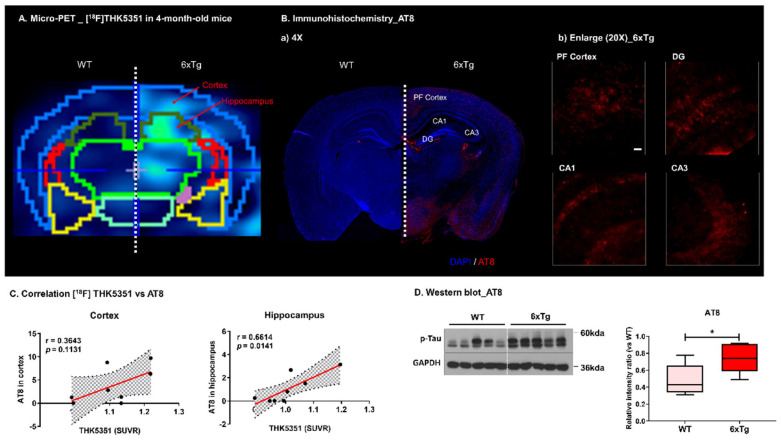
Figure 5.
Representative images of [18F]THK5351 and AT8 immunostained images in brain. (A) The [18F]THK5351 intensity of 4-month-old 6 × Tg mice was increased in the cortex and hippocampus compared with WT. (B) Immunostained brain tissues with AT8 antibody of 4-month-old 6 × Tg and WT mice brains. Counterstained with DAPI. Representative slices are shown for (a) WT and 6 × Tg mouse brains (4× magnification) and (b) cortex (PF) and hippocampus (DG, CA1, and CA3) regions of 6 × Tg mice brain (20× magnification) (all scale bars = 100 μm). AT8-immunoreactive p-Tau were shown in the cortex and in the hippocampus of 6 × Tg mice brain. (C) The correlation between [18F]THK5351 uptake and the level of p-Tau protein are assessed in the cerebral cortex and hippocampus of 6 × Tg mice by the nonparametric Spearman’s rank correlation test. Graphs show regression lines with 95% confidence intervals. [18F]THK5351 uptake significantly correlates with the level of p-Tau protein in the hippocampus, but not in the cortex of 6 × Tg mice. (D) The protein level of phosholyated tau (p-Tau) was signficantly increased in 6 × Tg compared with WT. Statistical analysis is performed using student’s t-test. * p < 0.01 vs. WT.

