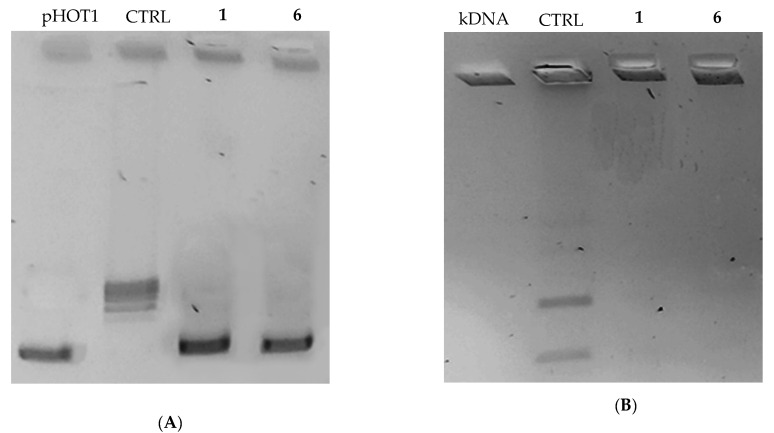
Figure 2.
hTopo I and hTopo II assays. (A) hTopo I relaxation assay. hTopo I was exposed to DMSO (CTRL) or compounds 1 and 6 at the concentration of 1 μM, then the products of hTopo I reaction were visualized on agarose gel; (B) hTopo II decatenation assay. hTopo II was exposed to DMSO (CTRL) or compounds 1 and 6 at the concentration 1 μM. The hTopo II reaction products were visualized on agarose gel. pHOT1, supercoiled plasmid DNA; kDNA, kinetoplast DNA; CTRL, control (DMSO); 1 and 6, tested compounds.

