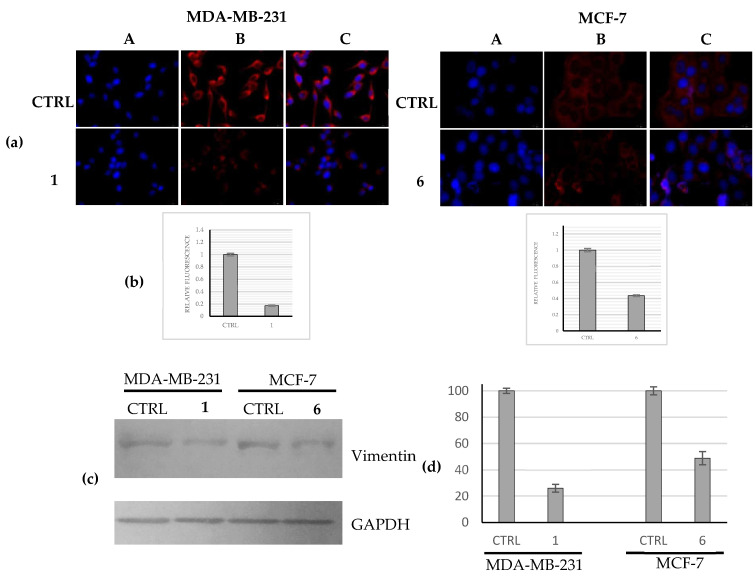
Figure 6.
Evaluation of vimentin expression levels. (a) Immunofluorescence studies: MDA-MB-231 and MCF-7 cells were treated with compounds 1 and 6, respectively, (used at their IC50 values) or with a vehicle (CTRL) for 24 h. After treatment, the cells were further processed, observed and imaged under the inverted fluorescence microscope at 40× magnification (for more details see Materials and Methods). Compound 1 induced a downregulation of the vimentin expression with respect to the CTRL cells in MDA-MB-231 cells. Panels A: nuclear stain with DAPI (λex/λem = 350/460 nm); Panels B: vimentin (Alexa Fluor® 568; λex/λem = 644/665 nm); Panels C: show a merge. Images are representative of three separate experiments; (b) Fluorescence quantification carried out using ImageJ; p < 0.001; (c) Western blots analysis: MDA-MB-231 and MCF-7 cells were treated with compounds 1 and 6, respectively, (used at their IC50 values) or with a vehicle (CTRL) for 24 h and then the total protein content was extracted and processed as reported in the Experimental Section. GAPDH: loading normalization. Images are representative of three separate experiments; (d) Western blots quantification carried out using ImageJ; p < 0.001.

