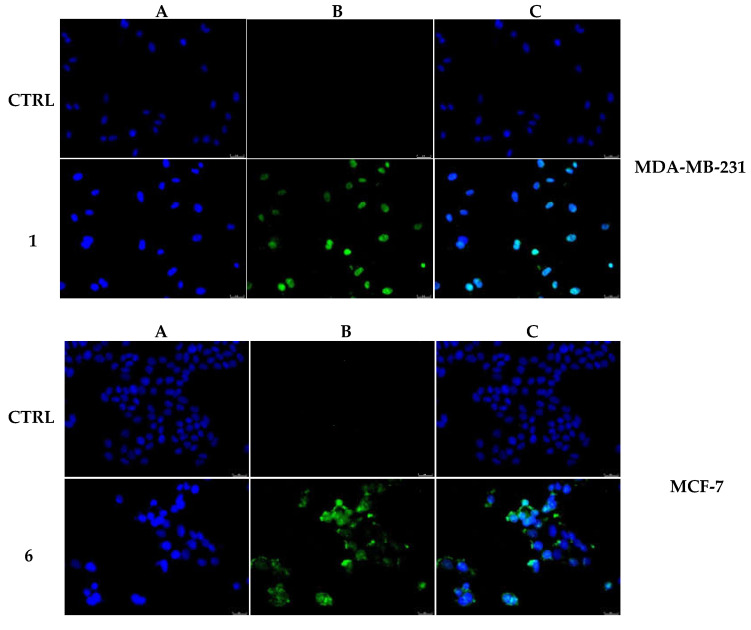
Figure 9.
TUNEL assay. MDA-MB-231 and MCF-7 breast cancer cells were treated with compounds 1 and 6, respectively, at the concentration equal to their IC50 or with vehicle (CTRL) for 24 h. Then they were exposed to the TdT enzyme and visualized under a fluorescence microscope (20× magnification). The green fluorescence indicates nuclei of cells undergoing apoptosis. Panels (A), DAPI λex/em 350 nm/460 nm. Panels (B), CFTM488 A λex/em 490 nm/515 nm. Panels C show the overlay channel.

