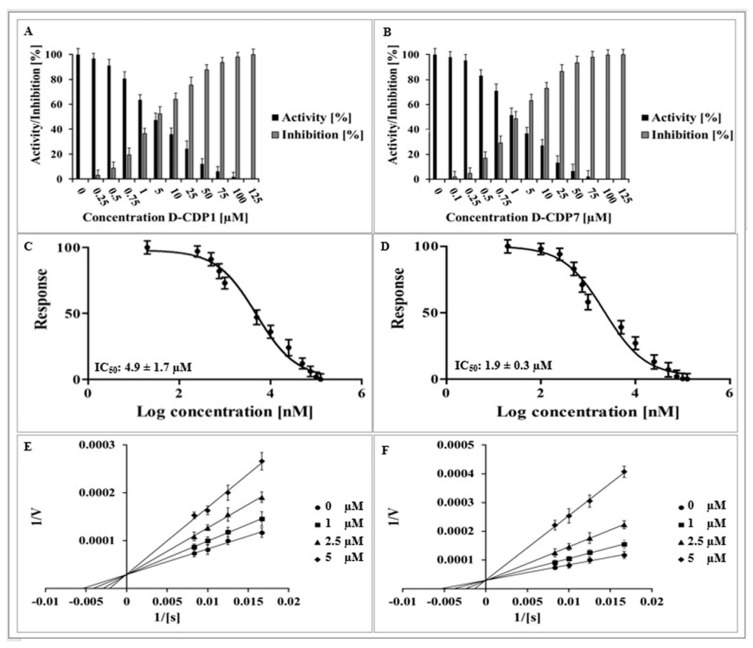
Figure 5.
Inhibition effect, dose-response curve, and inhibition mode of D-CDP1 and D-CDP7 over SARS-CoV-2 3CLpro. (A): Normalised activity and inhibition of SARS-CoV-2 3CLpro under D-CDP1 influence. (B): Normalised activity and inhibition of SARS-CoV-2 3CLpro under D-CDP7 influence. (C): Dose-response curve of D-CDP1 and SARS-CoV-2 3CLpro. The normalised response [%] of SARS-CoV-2 3CLpro is plotted against the log of the D-CDP1 concentration. (D): Dose-response curve of D-CDP7 and SARS-CoV-2 3CLpro. (E): Lineweaver-Burk plot for D-CDP1 inhibition of SARS-CoV-2 3CLpro. [S] is the substrate concentration; v is the initial reaction rate. (F): Lineweaver-Burk plot for D-CDP7 inhibition of SARS-CoV-2 3CLpro. Data shown are the mean ± SD from three independent measurements (n = 3).

