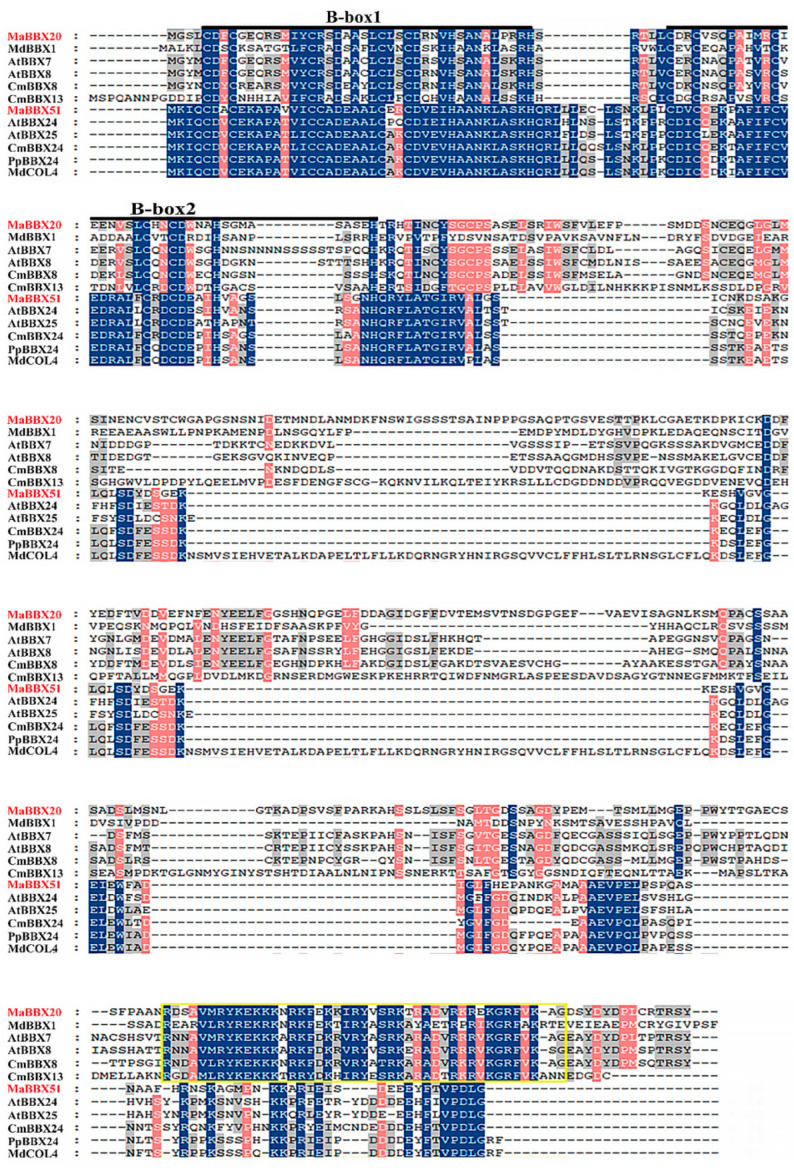
Figure 1.
Multiple sequence alignment of MaBBX20, MaBBX51, and other BBXs. The alignment was generated using the GeneDoc software. Blue, pink, and grey columns indicate 100%, 80%, and 60% identity, respectively. The B-box and CCT domains are marked by dark lines and the yellow square, respectively. GeneBank accession numbers for all proteins are listed in Supplementary Table S2.

