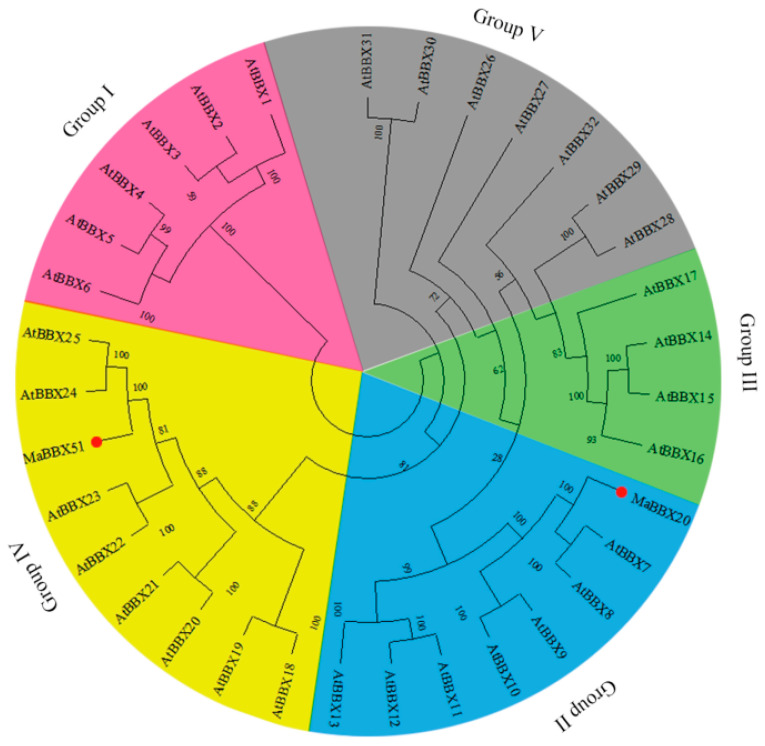
Figure 2.
Phylogenetic analysis of MaBBX20, MaBBX51, and 32 A. thaliana BBX transcription factors. The neighbour-joining phylogenetic tree was constructed using the MEGAX software. Numbers next to each branch represent the bootstrap values of 1000 replicates. MaBBX20 and MaBBX51 are marked by red dots. Five subfamilies (I to V) are indicated in pink, blue, green, yellow, and grey. GenBank accession numbers for all proteins are listed in Supplementary Table S2.

