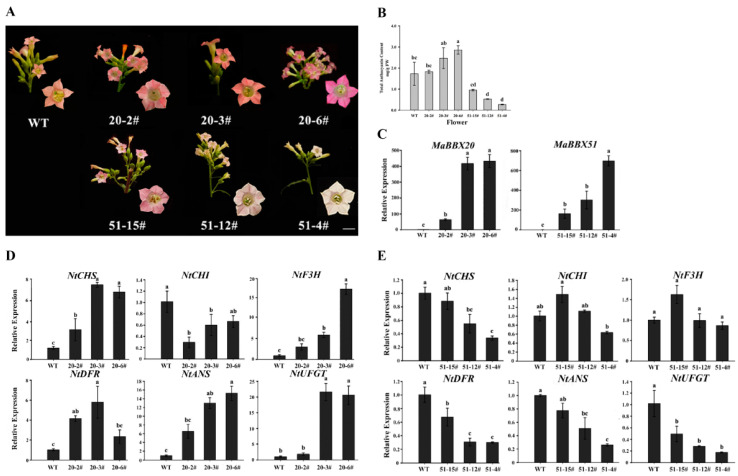
Figure 5.
Functional analysis of MaBBX20 and MaBBX51 in the tobacco plant. (A) Flower phenotypes of overexpressing transgenic lines. Three independent transgenic lines were used for each gene. Scale bar: 2 mm. (B) Anthocyanin content in tobacco corollas of transgenic lines. FW, fresh weight. (C) qPCR analysis of MaBBX20 and MaBBX51 expression in the corollas of their transgenic tobacco. (D,E) Relative expression levels of NtCHS, NtCHI, NtF3H, NtDFR, NtANS, and NtUFGT in the corollas of transgenic lines overexpressing MaBBX20 (D) and MaBBX51 (E). 20–2#, 20–3#, and 20–6# were transgenic lines of MaBBX20; 51–4#, 51–12#, and 51–15# were transgenic lines of MaBBX51. NtTubA1 was used as an internal control. Data are presented as the mean ± SD. Different letters above the bars indicate significantly different values calculated using one-way ANOVA followed by LSD analysis (p < 0.05).

