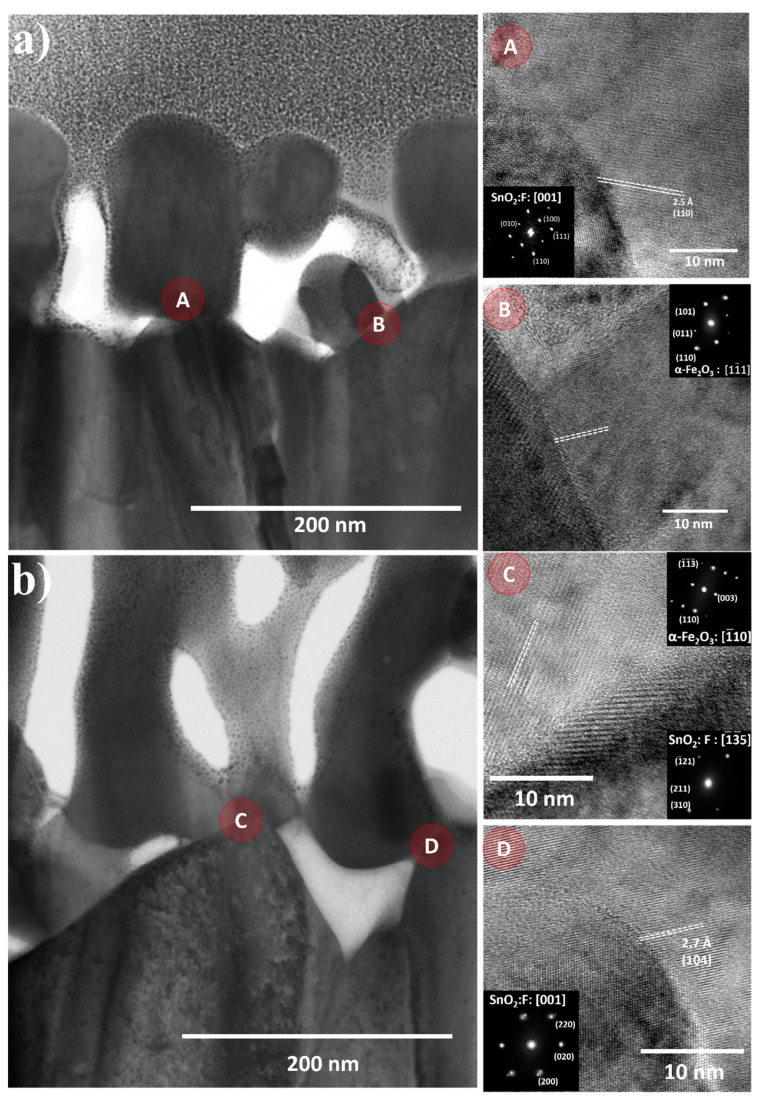
Figure 5.
TEM images of the hematite/FTO interface obtained with 500 mg·mL−1 at (a) 5 mT magnetic field and inset show HRTEM images and Fast Fourier Transform images of hematite and FTO (SnO2) indexed with the crystallographic planes along the zone axis of points A and B. (b) 50 mT magnetic field, and inset show HRTEM images and Fast Fourier Transform images of hematite and FTO (SnO2) indexed with the crystallographic planes along the zone axis of points C and D.

