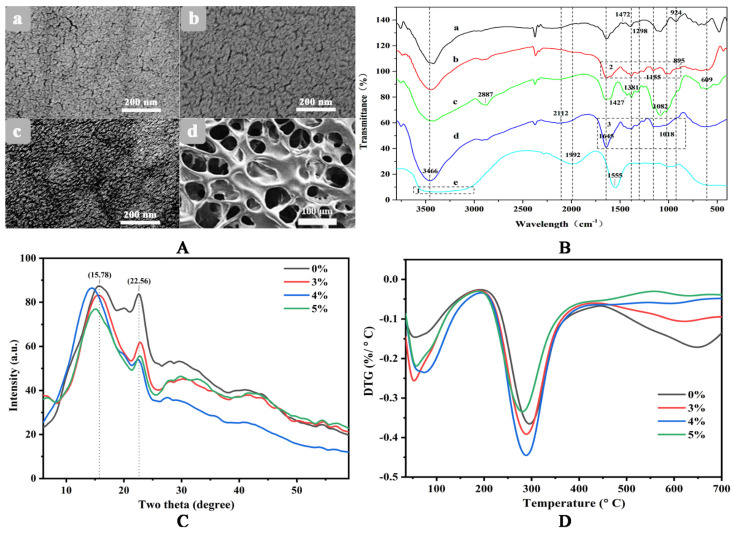
Figure 2.
SEM images (A), the spectra of FT-IR (B), XRD (C) and TGA (D) of hydrogels. In (A), signs a–d refer to the heat-dried hydrogels of CS, CS/γ-PGA and CS/γ-PGA/DOE, and the freezing-dried hydrogel of CS/γ-PGA/DOE, respectively. In (B), signs a–e refer to FT-IR spectra of neat γ-PGA, CS/γ-PGA hydrogel, neat CS, CS/γ-PGA/DOE hydrogel and DOE, respectively. In (C,D), the percentages refer to the contents of DOE in the hydrogel composed of 25% γ-PGA and 75% CS.

