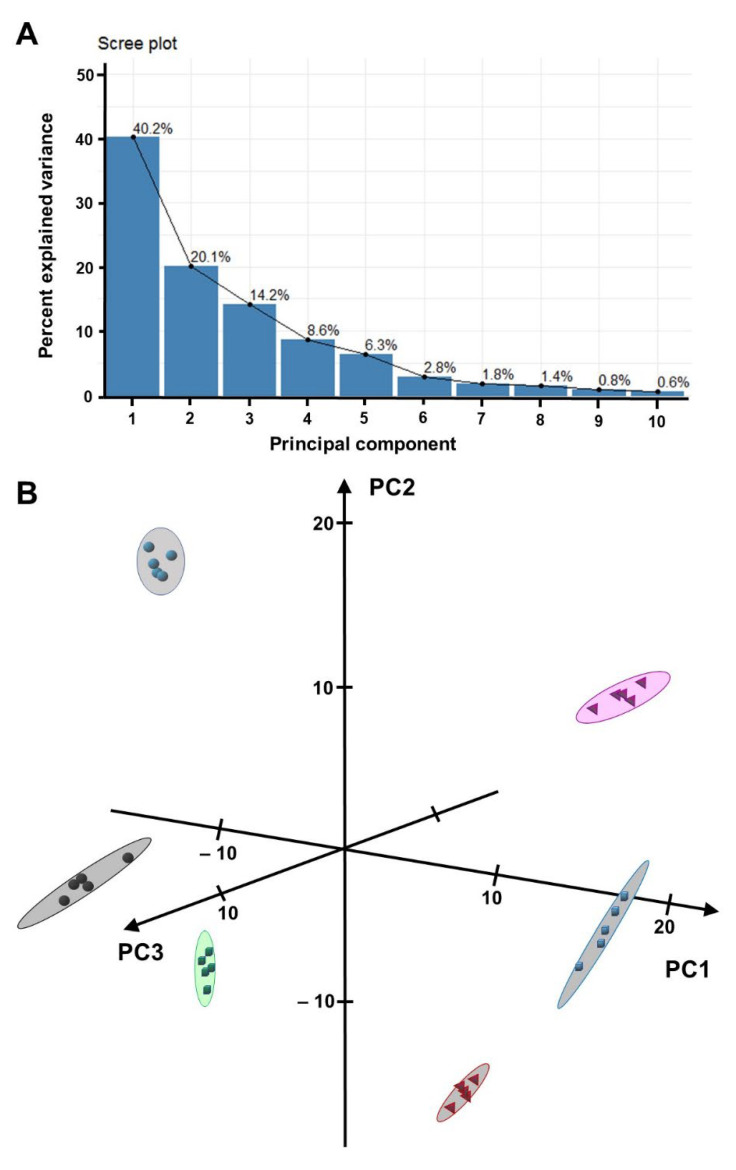
Figure 2.
Separation of Equisetum sample groups based on a principal component analysis (PCA) of metabolomics data. (A) Scree plot indicating that the first three principal components (PCs) explain 74% of variance across datasets. (B) Three-dimensional PCA plot visualizing the separation of samples from Equisetum arvense shoots (red pyramids), Equisetum arvense rhizomes (black spheres), Equisetum hyemale shoots blue cubes), Equisetum hyemale rhizomes (green cubes), Equisetum telmateia shoots (magenta pyramids), and Equisetum telmateia rhizomes (teal spheres).

